

Pointing out that Sales and Earnings growth across the major domestic indices are strong is trivial. The implications of that reality, however simple, are less so. With 80% of SPX constituents having reported and trends now entrenched, below is a quick highlight of 2Q17 Earnings along with some relevant top down context .
Summary
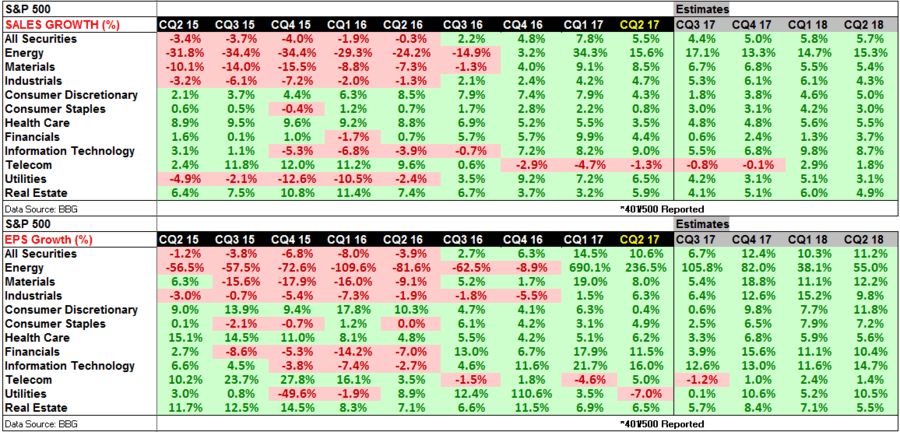
- Growth, Y/Y: SPX: Sales Growth = +5.5%, EPS Growth = +10.6%, NDX: Sales Growth = +10.4%, EPS Growth = +13.9%, INDU: Sales growth = 3.2%, EPS Growth = +9.7%
- With a baseline Quad1/Quad 2 outlook for the domestic economy over the balance of the year and strong/above trend sales and earnings growth, the fundamental case for more than transient, countertrend weakness is greatly diminished. Accelerating growth and strong top/bottom line trends are just not the macro factor cocktail negative equity and credit spread blowout theses are made of.
- After comping the profit recession trough in 1Q, it’s little surprise that rate-of-change trends have slowed moderately in 2Q. Importantly, however, 2Y growth comps are flat in 2Q suggesting the deceleration is almost singularly a base effect phenomenon with the underlying trend improvement persisting.
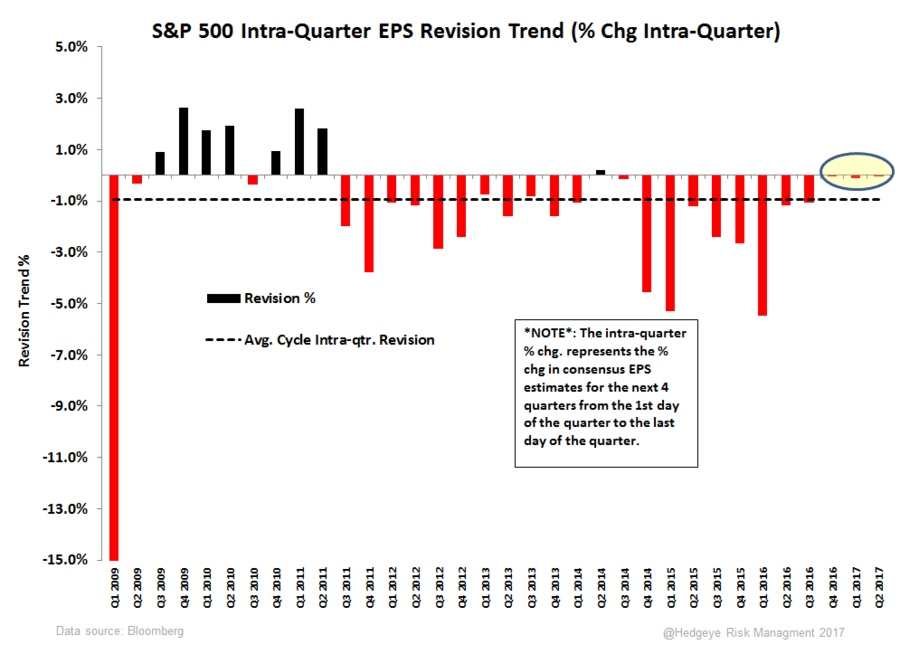
- Intra-quarter revision trends were non-negative for a 2nd quarter here in 2Q17. In other words, the progressively-and-significantly-lower-estimates-into the print- then-beat-and-everyone-cheers pattern that has characterized post-recession earnings was again absent.
- Weaker dollar impacts should provide some incremental flow through support to earnings trends as larger cap multinationals (where revenue share concentration is rising) stand to benefit disproportionately.
- Consensus expects another deceleration in Y/Y trends in 3Q followed by a subsequent reacceleration into 2018. We don’t do the perennial/perma-panglossian ‘back-end loading” of estimates but with an expectation for growth to accelerate over the coming quarters we would broadly agree with the directional trend in consensus estimates. Accelerating wage inflation alongside further soft productivity trends is an interesting combo to consider as a rising share for labor income would largely be paid for via corporate profitability but such a potentiality remains a conspicuously known unknown and a recurrent false fear for years now.
----------
Earnings Growth Breakdown
401 out of 500 companies in the S&P 500 have reported thus far. Sales and earnings growth, while tracking lower sequentially at +5.5% and 10.6% respectively (+ 7.8% and +14.5% for sales and earnings growth in Q1) has come in strong so far with the 2yr comp stack coming in at around +3.3% for the second consecutive quarter. The strength is broad-based with every sector in the S&P 500 reporting Y/Y earnings growth so far.
Within the Nasdaq 100 index, 71 of 102 companies have reported with top and bottom line comps coming in at +10.4% and +13.9% respectively. Again, this is a sequential deceleration (+11.7% and +18.0% in Q1) within a strong growth trend. 2/3rds of the index is concentrated in information technology and consumer discretionary. The +20.0% Y/Y earnings growth rate for information tech (40 out of 100 companies) has been the main driver of strength for the index.


Beat/Miss Expectations Internals
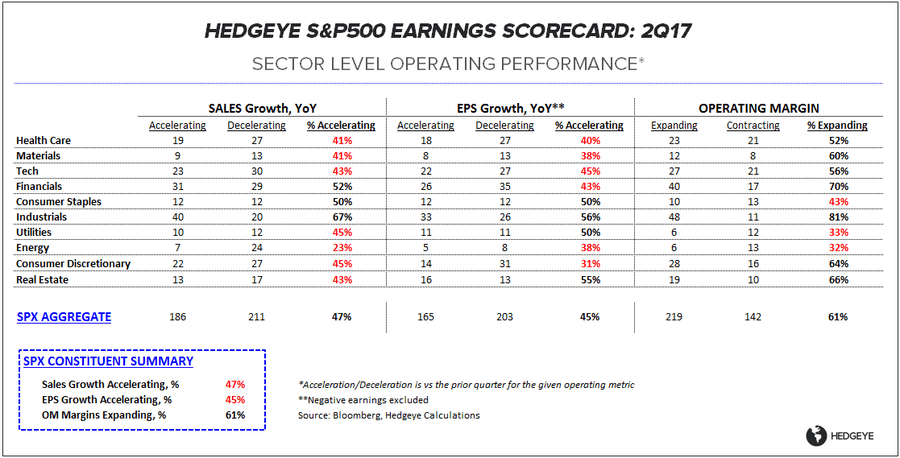
The negative 2nd derivative growth trend - if double digit Y/Y earnings growth is to be construed as ‘negative’ - has so far been met by positive beat/miss dynamics in most S&P 500 sectors.
For the second consecutive quarter, S&P 500 earnings have beat estimates by 5.1% in the aggregate. For context, the 5 year average beat rate is 4.2%.
Across SPX sectors, 6 of 10 (ex. real estate which was recently added) have beaten bloomberg earnings estimates by a wider gap than the 5 yr avg. beat rate. Notable call-outs include:
- Information Technology: +7.3% earnings beat vs. +3.9% on average
- Healthcare: +6.2% earnings beat vs. +4.5% on average
- Telecom: +4.0% earnings beat vs. +1.4% on average


Revision Trends
In the first chart below we look at intra-quarter forward earnings revisions trends throughout the quarter to observe the evolution of S&P 500 earnings estimates. This helps to gauge guide-down and beat dynamics.
For the third consecutive quarter, earnings revisions were muted from the start to the end of the quarter, so the +5.1% bottom-line beat vs. +4.2% average beat for the S&P 500 over the last 5 years came on no downward revision. This cycle, the average intra-quarter EPS revision has been ~-1.0%.
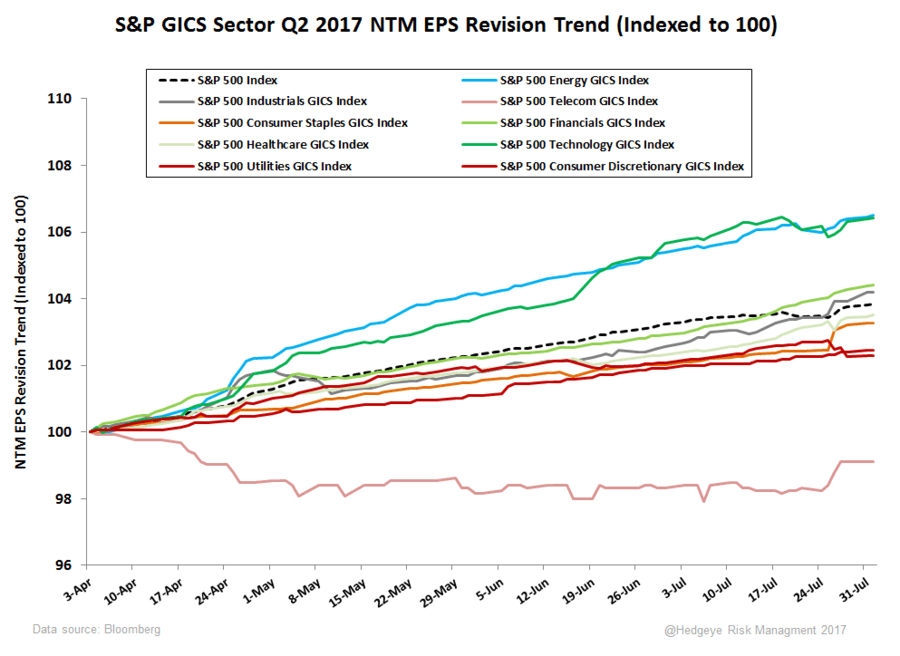
From the beginning of Q2 until now, the largest positive revisions in NTM EPS estimates con be observed in the information technology and energy sectors – These two sectors were the major contributors to S&P 500 index EPS estimates being revised higher by +2.4% from the start of Q2 until now. The clear laggard from a revisionist standpoint is the telecom sector where NTM eps has been revised lower on a relative and absolute basis since the beginning of Q2.
Christian B. Drake
@HedgeyeUSA
Ben Ryan
dty
