“Great theories are often humbled by mere facts.”
-Benoit Mandelbrot
They can never have enough of the guy. Fractal fans love The Brot! To his point on humility, I’ve been humbled by the sheer amount of feedback and questions we’ve had lately on how and why we use a dynamic @Hedgeye Risk Range to help us with market timing.
If you want to geek out on both the math of it all and a metaphysical metaphor, on pages 175-181 of The (mis)Behavior of Markets, Mandelbrot does a brilliant job tying together the flooding of The Nile and what he calls his “re-scaled range.”
|
“The range from high to low flood levels widened by three-quarters-power of the standard deviation… and that sounded like a mere variant of my cotton formula. The big floods, I reckoned, were like big price jumps; the disastrous droughts were market crashes.” |

Back to the Global Macro Grind…
With the Nasdaq Composite Index closing at yet another all-time high of 6390 = +18.7% YTD yesterday, I think we can call that a big flood! Meanwhile droughts and market crashes have come in things like Oil & Gas Stocks (XOP) this year.
Importantly, when it comes to applying a dynamic risk range process to measuring and mapping markets, Mandelbrot also taught us that “it’s not just the size of the floods, but also their precise sequence that matters.” (pg 178)
That’s why, every single day, I humbly submit that it will help you, immensely, to physically write down market prices, economic data, etc. For me at least, this is a way to objectively absorb and acknowledge all that is happening (as opposed to what I think should happen).
In addition to the ATH (all-time high) in the Nasdaq, what are some of the most important things I wrote down in my notebook this a.m.?
- So far, 84 of 500 S&P companies have reported aggregate EPS growth of +11.8% year-over-year
- Eurozone Consumer Confidence slowed to -1.7% JUL vs. -1.3% JUN
- SP500 closed at its all-time high of 2473
- Russell 2000 closed at its all-time high of 1442
- Front-month US Equity Volatility (VIX) closed close to its all-time low (ATL) at 9.58
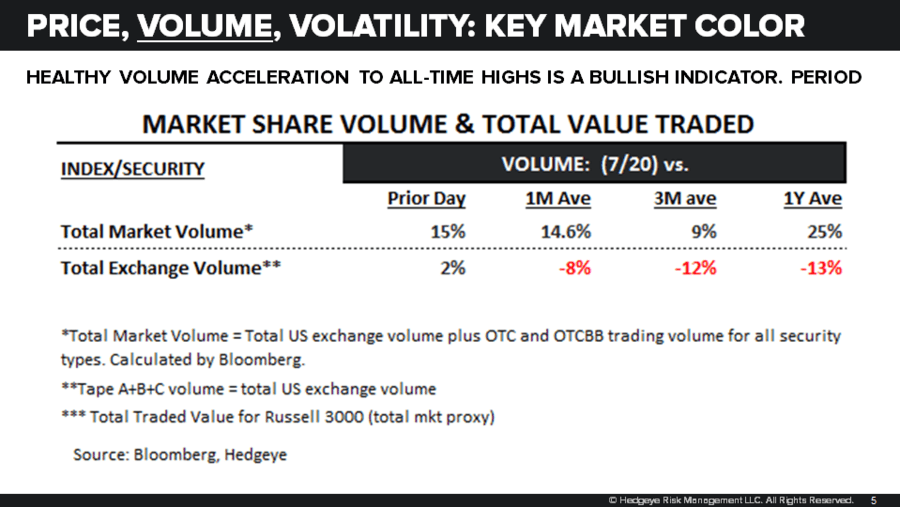
- Total US Equity Volume was +15% and +25%, respectively, vs. its 1-month and 1-year averages
- Biotech (IBB) led Sector Style gainers yesterday +1.0% to +21.7% YTD
- Oil & Gas Stocks (XOP) led Sector Style losers yesterday -1.9% to -22.7% YTD
- Japanese Stocks closed down -0.2% on a +0.2% Yen vs. USD move
- KOSPI closed at yet another all-time closing high of 2450
- Chinese stocks bounced this week on the largest PBOC liquidity injection since January
- Australian and Indonesian stocks continue to underperform KOSPI on a trending basis
- French (CAC) and Spanish (IBEX) Stocks are down -1.4% and -1.8% in the last month, respectively
- Russian Stocks (RTSI) failed @Hedgeye TRADE and TREND resistance this morning
- EUR/USD shrugged off a dovish Draghi and is back to the top-end of its $1.13-1.16 risk range
- European Bond Yields (10yr) took Draghi’s discussion as dovish and are lower again this a.m.
- CRB Commodities Index is approaching the top-end of its 171-181 risk range and remains bearish TREND
- Oil is +0.5% this morning and remains bearish TREND @Hedgeye too (top-end of range = $47.80 WTI)
- Gold is +0.3% this morning (on down real rates) and is approaching the top-end of its $1 range
- Copper is +1.0% this morning signaling immediate-term TRADE overbought (i.e. top-end of the range)
- UST 10yr Yield has corrected right back to the low-end of its 2.23-2.33% immediate-term risk range
- German 10yr Bund Yield is down 2 beeps to 0.50% with an immediate-term range of 0.46-61%
Because these are notable data points to me that doesn’t mean that they are going to be noteworthy to everyone else. And that is precisely the point of the exercise. Unless I do this, I’m just chasing someone else’s “news” and/or views.
Measuring, mapping, sequencing… over and over and over again. That is what we do.
And while I’m surely going to get macro market ideas, positions, and theories wrong… this process helps me stay wrong less of the time. To me, losing-less is a big part of saving and making money over time.
One thing I’ve had wrong this week was re-shorting the Euro ahead of Draghi’s ECB meeting and the reason why I’ve been wrong in the short-term is crystal clear. Draghi has a theory on both European growth and inflation accelerating whereas we see both slowing.
We’ll only get paid on this idea if A) the data is reported in our favor and B) Draghi is forced to change his forecasts within 3-6 months in kind. In the meantime, I’m humbled by the mere fact that at $1.16 EUR/USD, Mr. Market disagrees with me.
Our immediate-term Global Macro Risk Ranges (intermediate-term TREND views in brackets) are now:
UST 10yr Yield 2.23-2.33% (neutral)
SPX 2 (bullish)
RUT 1 (bullish)
NASDAQ 6 (bullish)
XOP 30.67-32.92 (bearish)
Nikkei 190 (bullish)
VIX 8.92-11.16 (bearish)
EUR/USD 1.13-1.16 (bearish)
Oil (WTI) 44.09-47.81 (bearish)
Gold 1 (neutral)
Copper 2.63-2.75 (bullish)
AMZN (bullish)
FB 160-167 (bullish)
Best of luck out there today and enjoy your weekend,
KM
Keith R. McCullough
Chief Executive Officer