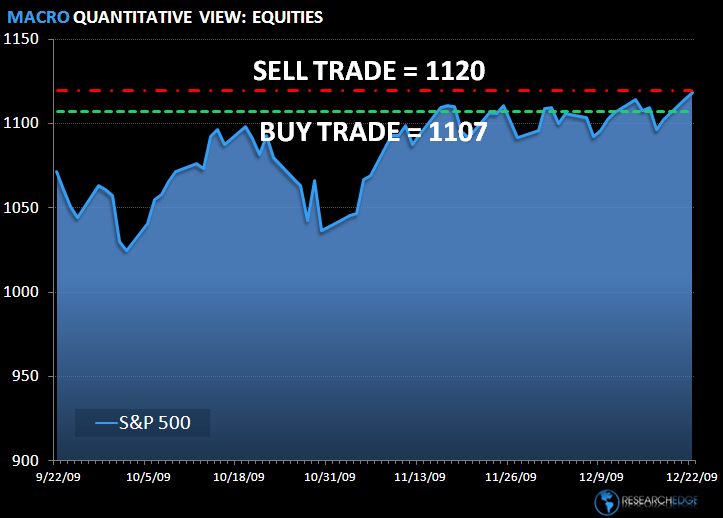
Yesterday, the S&P pushed to a new a high for the year, closing up 0.4% on yesterday’s trade line of 1,118. In very light pre-holiday trading, volume declined 5.6% day-over-day and the breadth of the market narrowed. The MACRO calendar drove yesterday’s optimism on the better-than-expected housing data, which sparked a rally in the homebuilders and housing-leveraged stocks. Countering that optimism was another downward revision to Q3 GDP.
The higher beta small-cap names continue to outperform with the NASDAQ and Russell 2000 rising 0.7% and 0.8%, respectively. The VIX continues to be broken on all three durations (TRADE, TREND and TAIL), breaking below 20.00 yesterday to close down 4.6% at 19.54.
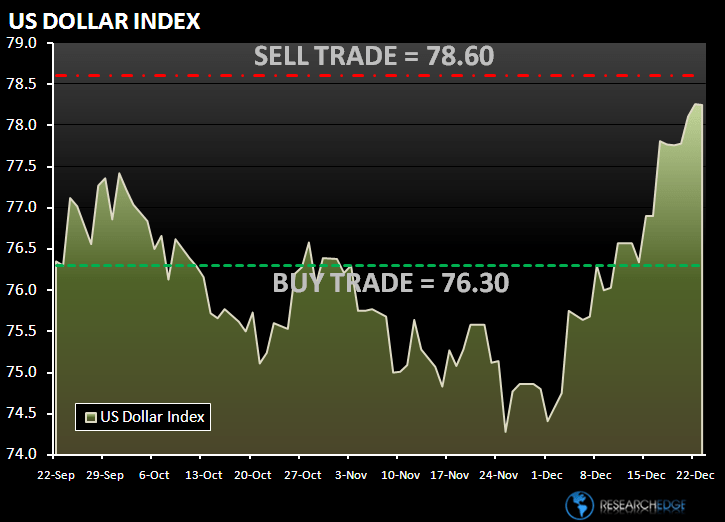
There continues to be a breakdown in the inverse correlation between US equities and the dollar that has dominated the MACRO landscape in 2009. The Dollar index has increased for the past seven days and the S&P has now been up for the last three. The Dollar index is up 0.71% in the past three trading days and the S&P 500 is up 1.99%.
Housing-related stocks were among the best performers yesterday with the XHB +2.25%. The main driver of yesterday’s performance was a better-than-expected existing home sales number. The NAR reported that existing homes sales rose 7.4% month-over-month in November to a 6.54M annual rate; the highest since February of 2007. Total inventories fell 1.3%, while the months’ supply dropped to 6.5 from 7 in October (single-family months' supply fell to 6.2 from 6.8). Notable gainers in the group included builders KBH +6.9%, PHM +4.7% and TOL +4.5%.
Yesterday, the three best performing sectors were Technology, Consumer Staples and Materials. Increased earnings expectations helped the Technology (XLK) sector outperform the S&P 500 by 0.4%. The bright spot was the semi space with the SOX +0.6% yesterday. Two standouts were AMKR and JBL, which both posted guidance ahead of Street expectations.
The momentum behind the RECOVERY trade has helped Materials (XLB) outperform, but has left the Industrials (XLI) behind. The Road& Rail (R), Air Freight (FDX) and Machinery (FLS) were among the laggards. The best performing stock was FLIR Systems, up 3.5% on the day.
From a risk management standpoint, the ranges for the S&P 500, the Dollar Index and the VIX are seen in the charts below. The range for the S&P 500 is 16 points or 0.5% upside and 1.0% downside. At the time of writing, the major market futures are slightly higher.
The CRB improved by 0.04% yesterday; grains, Energy and Livestock all traded higher on the day.
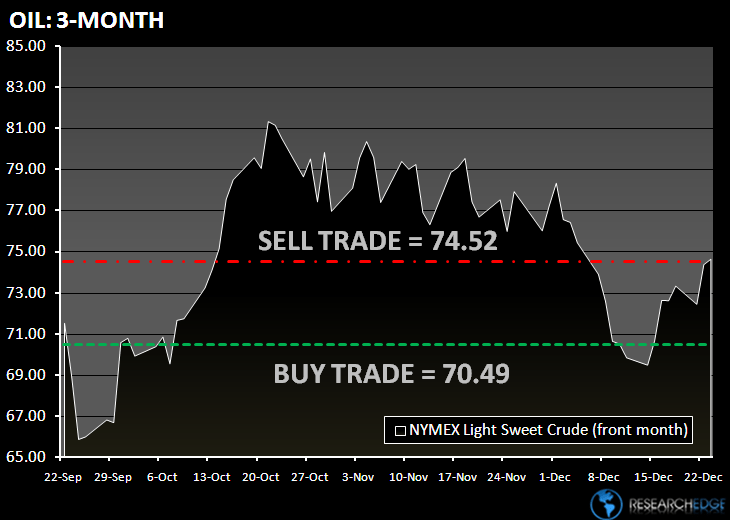
In early trading, crude oil held steady above $74 a barrel in New York before a U.S. Energy Department report on inventory levels. The report today is expected to show oil inventories shrank by 1.6 million barrels in the week ended Dec. 18, according to the median estimate by Bloomberg. The Research Edge Quant models have the following levels for OIL – buy Trade (70.49) and Sell Trade (74.52).
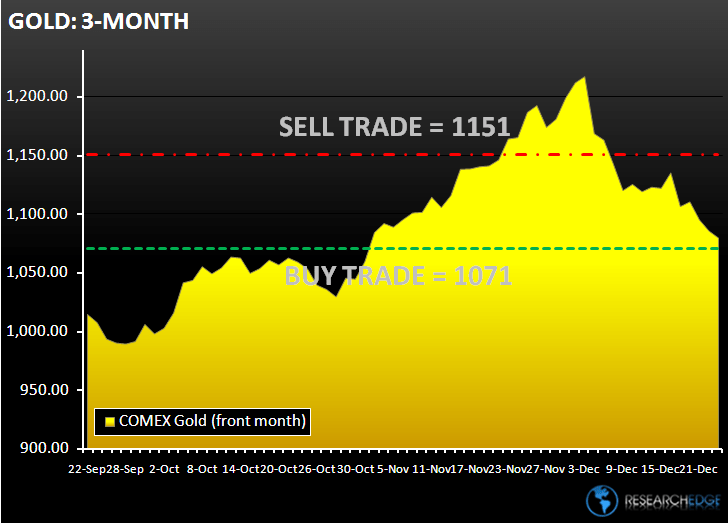
Gold declined for the third day in London. Gold declined by 0.3% to 1,080. The Research Edge Quant models have the following levels for GOLD – buy Trade ($1,071) and Sell Trade ($1,151).
Copper rose in London on speculation that demand in China and the U.S. will strengthen. Also, the dollar decline has created an arbitrage opportunity for Chinese speculators. The Research Edge Quant models have the following levels for COPPER – buy Trade (3.09) and Sell Trade (3.15).
Howard Penney
Managing Director