Yesterday, the Research Edge QUANT models flashed the S&P 500 breaking the TRADE line on big volume. Also, Consumer Staples (XLP) and Materials (XLB) broke the TRADE line, joining Energy (XLE) and Financials (XLF). The XLF is the only sector broken on both TRADE and TREND. We continue to favor the low beta sectors of Healthcare (XLV), Utilities (XLU) and Technology (XLK).
The Dollar index is up five of the last six days and 2.2% over the same time period. Until yesterday the S&P 500 was resisting the gravitational pull of everything priced in dollars going down as the dollar rallied. Although the Dow finished lower by 1.3% yesterday, the index is now down for the fourth straight day.
The fact remains that the FED is behind the curve and the strong dollar is communicating that message. There were a number of headwinds at work today, highlighting the pickle the FED is in. The economy has improved from a crisis levels, but how can the FED raise rates with the consumer struggling and there be no clear path to better times?
Yesterday Initial jobless claims rose to 480,000 for the week-ended December 12th, ahead of consensus expectations for a decline to 465,000. Continuing claims rose 5.2M following a big decline last week. However, the four-week moving average fell to 468,000 from 473,000, its lowest level since September 2008. While yesterday’s jobless claims number is a small step backward from the past three weeks, it’s a step backward nonetheless.
The Financials (XLF) continue to underperform and it feels like another bubble is bursting. The XLF underperformed the S&P 500 by 70bps yesterday and nearly 1000bps over the past three months. While Discover (DFS) led the group down, the banks and brokers were the real problem. The bulk of the focus was Citi (C) and its inability to price a massive secondary offering. The pricing of C was so bad that “Timmy” did not want to take a loss on “our” position.
The Materials (XLB) was the worst performer yesterday, with much of the damage stemming from a spike in the dollar. The Chinese appear to be flexing their muscles as it relates to a new potash contract. It’s now widely expected that the new contract price will be lower than the current global spot price.
From a risk management standpoint, the ranges for the S&P 500, the Dollar Index and the VIX are seen in the charts below. The range for the S&P 500 is 12 points or 0.5% upside and 0.5% downside. At the time of writing the major market futures are trading higher.
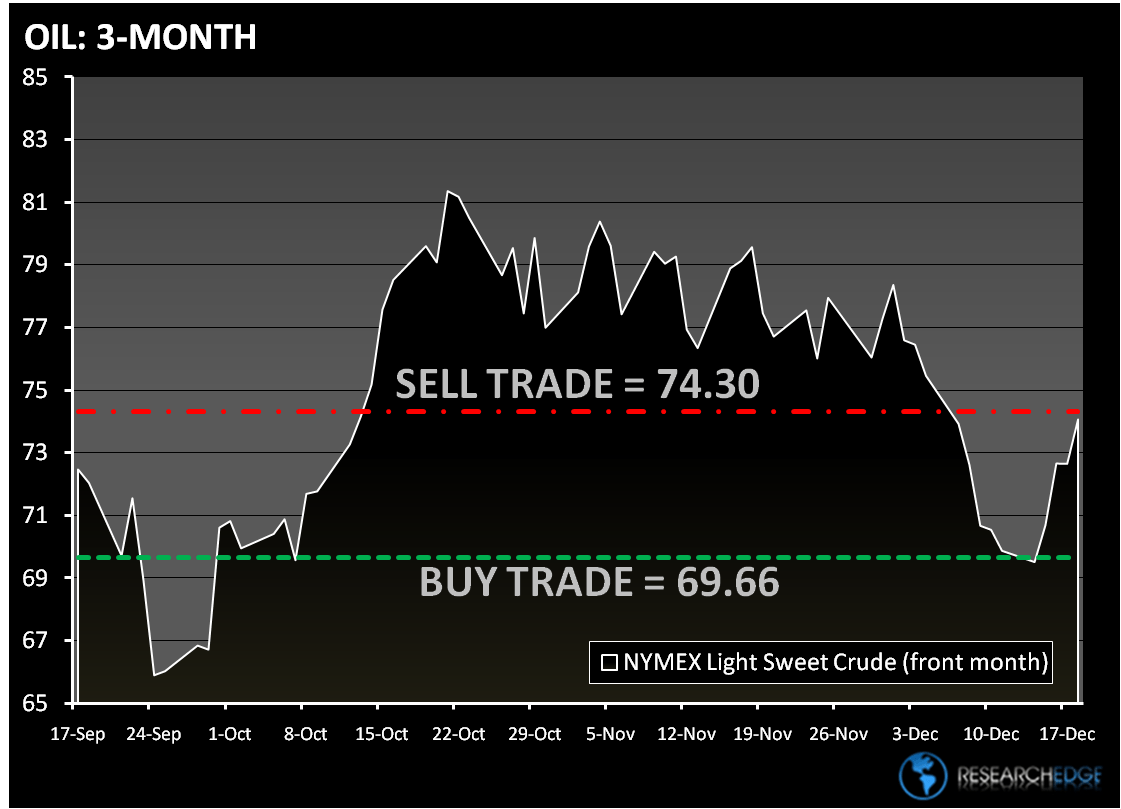
In early trading crude oil rose in New York and is poised for its biggest weekly gain since October on optimism demand will increase amid improved prospects for a global economic recovery. The Research Edge Quant models have the following levels for OIL – buy Trade (69.66) and Sell Trade (74.30).
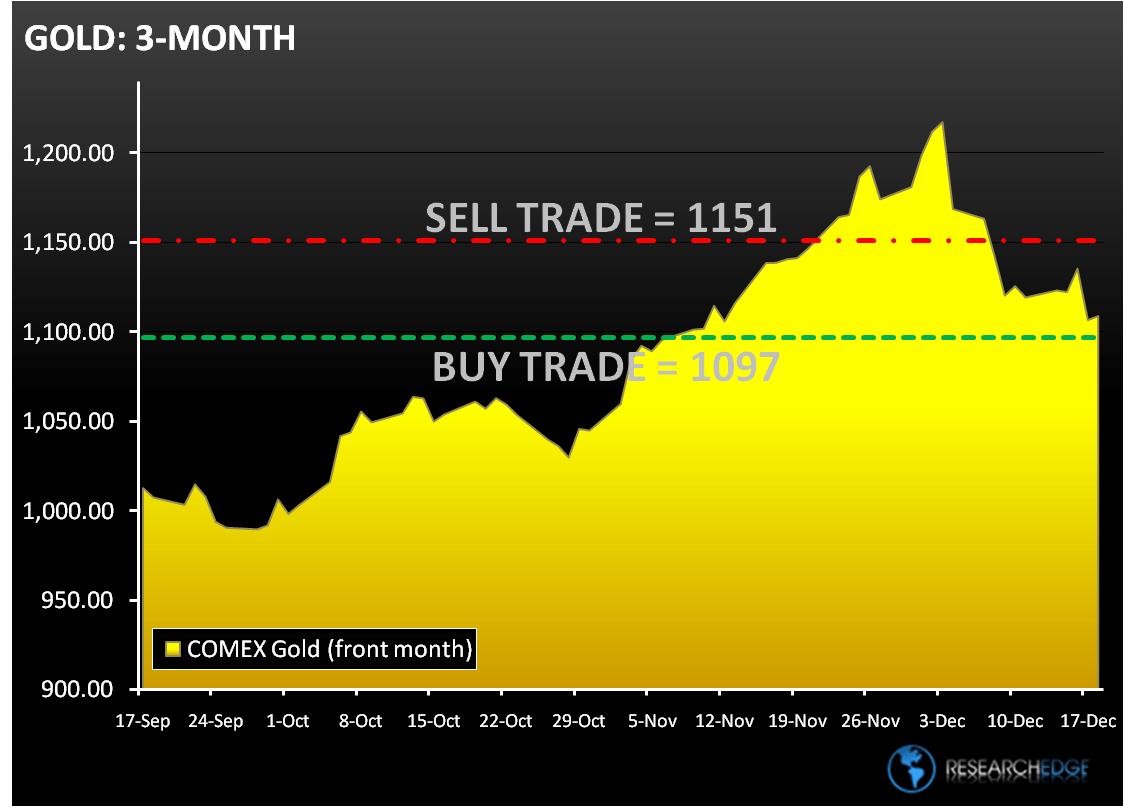
Gold is trading 0.2% higher at $1,101.41 an ounce in Singapore after yesterday it dropped the most in almost two weeks. Spot gold fell below $1,100 yesterday for the first time since Nov. 10. The Research Edge Quant models have the following levels for GOLD – buy Trade ($1,097) and Sell Trade ($1,151).
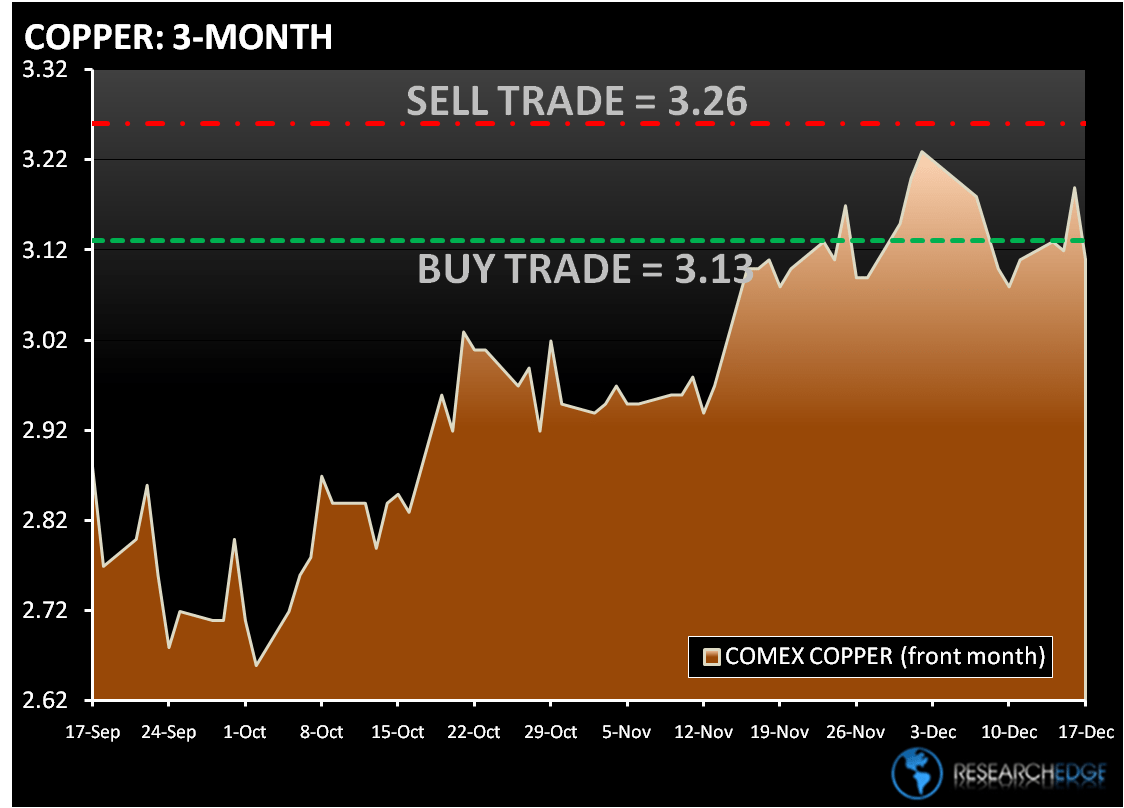
Copper fell 2.4% yesterday, the most since Oct. 30th. Although copper is still up 1.1% this week after better-than expected U.S. housing data. China’s imports recovered from a nine-month low amid a drop in domestic inventories. The Research Edge Quant models have the following levels for COPPER – buy Trade (3.13) and Sell Trade (3.26).
Howard Penney
Managing Director