Excerpt from this morning's Early Look:
It’s always critical to measure and map what stocks are doing within the backdrop of FX, Commodities, Rates, etc. obviously.
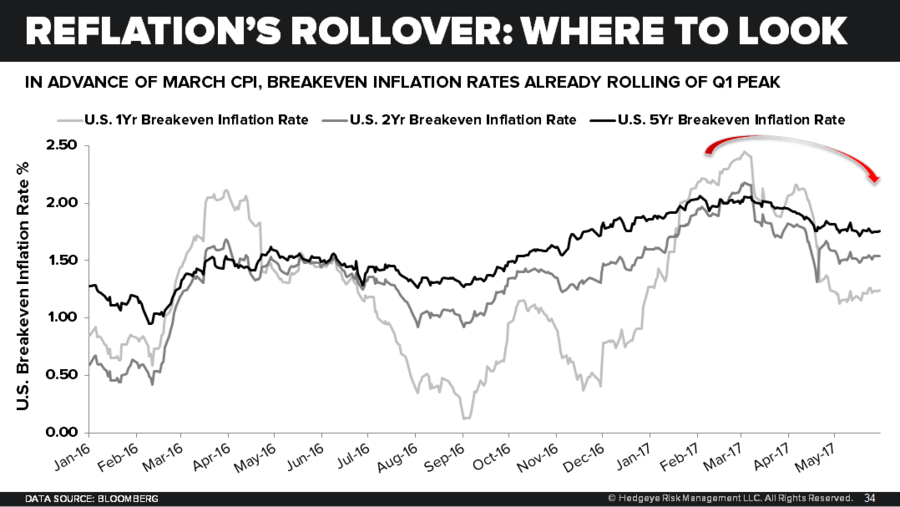
The simple takeaway = #Reflation’s Rollover. That’s partly why the USD has weakened. It’s definitely why bond yields have traded side-ways to down on the long-end of the curve. And it’s why our 0% asset allocation to Commodities has been right.
What happens when the inflation component of bond yield and FX expectations fall? Well, “reflation” stocks underperform real-growth expectations stocks. And we saw that (again) last week too.