For those who didn’t know that oil is priced in dollars, now they know.
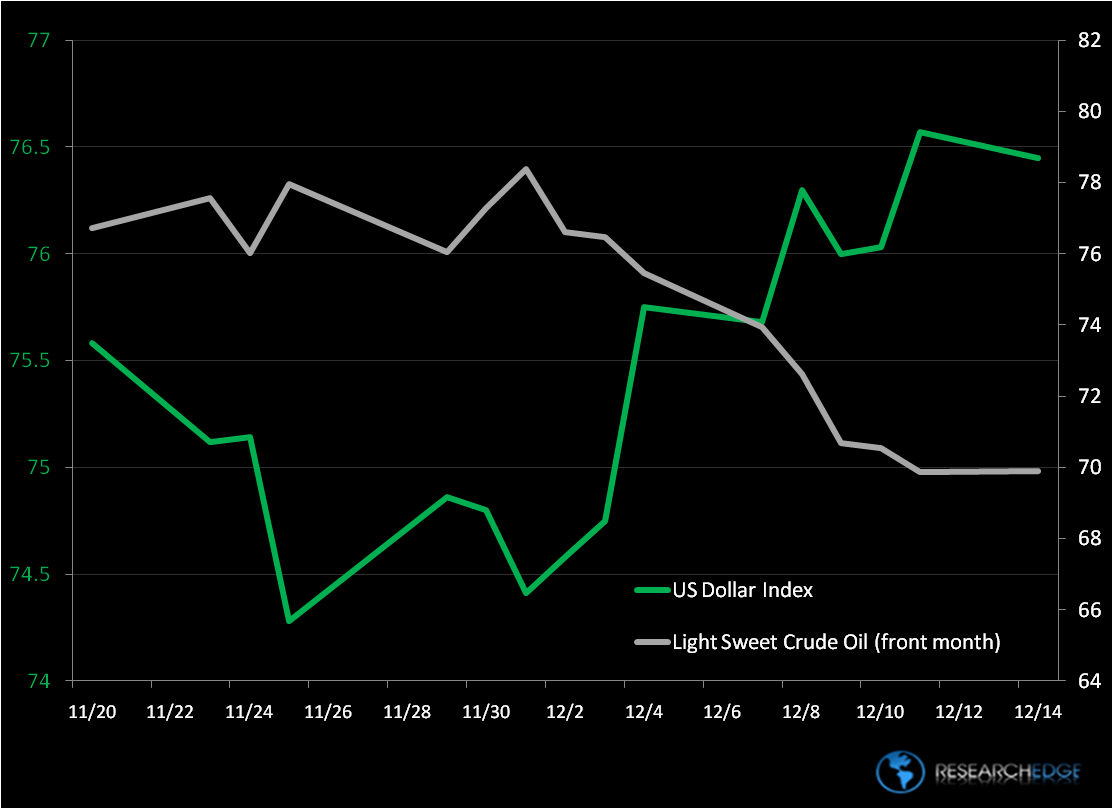
The chart below outlines the price moves we have seen in the last 3 weeks:
- Week of November 23rd: USD locks in its YTD bottom, trading down -1% week-over week and oil stops going up, closing down -2% wk/wk
- Week of November 30th : USD rallies sharply, closing +1.5% wk/wk, and oil closes the week down another -1%
- Week of December 7th: USD closes up for the 2nd consecutive week (up +0.84%), and oil finally gets smoked, losing another -7% wk/wk
Now we can either argue that the price of WTIC Oil topped first, providing us a lead indicator for a Bottoming of the Buck, or we can argue that continued strength in the US Dollar has perpetuated weakness in the oil price. We don’t have to argue either. We’d accept both arguments as fair.
What we don’t accept is that price moves aren’t “fundamental.” We equate marked-to-market prices to the official score in any professional sport. Market analysts can make up excuses for wins and losses, but at the end of the day all that matters is the score. Prices don’t lie, people do.
Our immediate term TRADE ($75.33) and intermediate term TREND ($76.30) lines for the US Dollar are now flashing bullish.
Our immediate term TRADE ($$77.11) and intermediate term TREND ($74.30) lines for WTIC Oil are now flashing bearish.
KM
Keith R. McCullough
Chief Executive Officer