Overnight we were issued a whole new round of Chinese economic data. Since equity markets in Asia have started to lose their upward price momentum this week, I am left asking myself whether that’s it? The leading indicator in answering this question (the Shanghai Composite Index) closed down on the “news”…
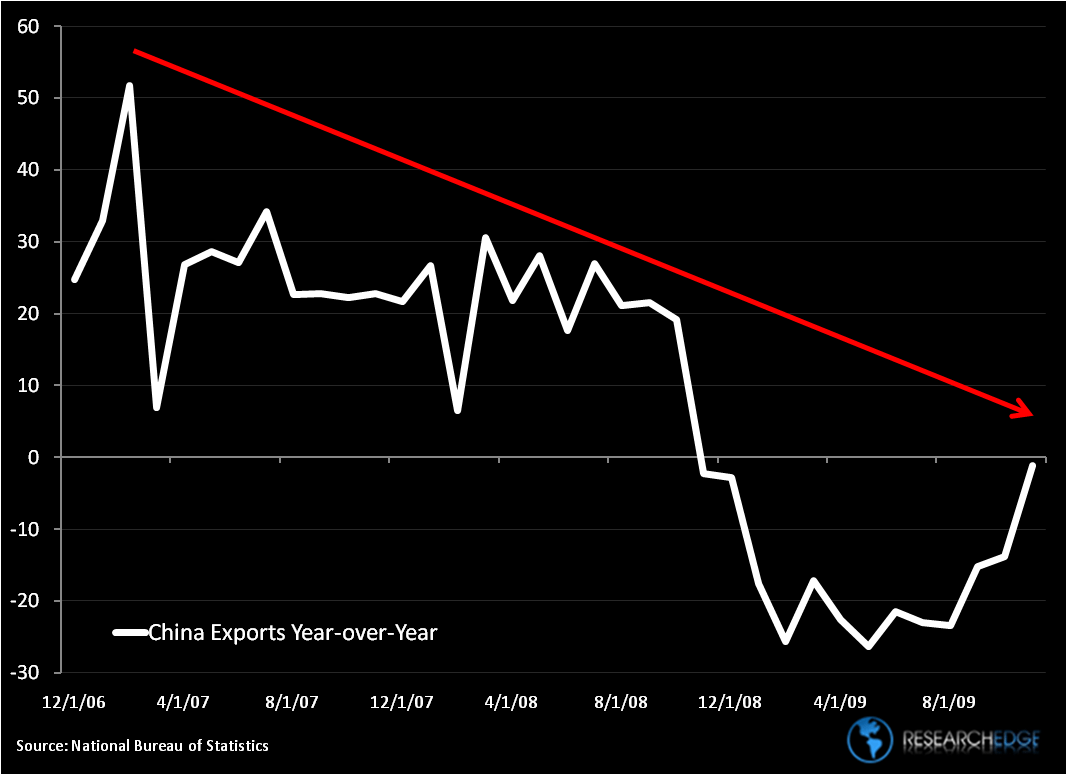
In the chart below Matt Hedrick and I contextualize what the Street is labeling as “better than expected” Chinese export data. While, on the margin, the export data continues to improve sequentially, all we have really observed here is a rally to lower-highs.
We understand that China is not all about exports (34% of GDP). On the internal consumption front, we actually saw monthly Chinese Retail Sales slow sequentially as well (from 16.2% in October to 15.8% in November).
The red arrow in the chart shows the series of lower-highs we have seen in Chinese Exports since export demand was white hot (2006-2007). You can look at this chart in two ways: 1. A rally to a lower high (bearish) or 2. A pending breakout to the upside (bullish).
While negative year-over-year export growth of -1.2% in November is not absolutely bullish, what has been bullish is what we have seen on the margin in China since her 2008 lows. However, in terms of export recovery, THE question remains: Is that it?
If the Chinese local A-shares were not making a series of lower-highs and if the H-shares on the Hang Seng Index were not breaking down from an immediate term TRADE perspective, I would give this Chinese Export chart the bullish benefit of doubt. For now, I am paid to be skeptical. Market prices don’t lie.
There are plenty more bulls in the China shop today than when we got bullish (December of 2008), to be worried about.
KM
Keith R. McCullough
Chief Executive Officer