MCD is scheduled to report November same-store sales numbers before the market opens on Tuesday. It is important to remember that headline numbers will look worse than underlying trends as November 2009 had one less Saturday than November 2008. In October 2009, the calendar shift/trading day adjustment, which included one extra Saturday relative to October 2008, boosted reported same-store sales growth by 1.0% to 1.7%, varying by area of the world. I would expect about this same magnitude of negative impact on reported results in November.
Taking that into consideration, I wanted to provide comparable sales ranges for each geographic segment as a benchmark of what I think would be GOOD, NEUTRAL, or BAD results based largely on 2-year average trends.
U.S. (facing +4.5% comparison from last year, calendar shift helped result by 0.0% to 2.8%):
GOOD: Any positive number would signal that October’s negative result was only a 1-month blip. Considering the negative 1% to 1.7% impact on reported results, I don’t think investors are expecting positive comparable sales growth as this would point to a sequential improvement in 2-year average underlying trends. For reference, a reported +0.5% would imply that underlying growth is closer to +1.5%, which would signal that 2-year average trends had improved nearly 100 bps from October levels.
NEUTRAL: -1% to flat would imply underlying growth of approximately flat to +1%, excluding the timing/calendar shift, and 2-year average trends that are about even with to slightly better than October. Like last month, this range of results, though neutral from an investor sentiment perspective as it relates to expectations, is not a favorable sign for current trends. Before October, MCD had not reported a decline in U.S. same-store sales growth since March 2008 so two consecutive months of declines would not be good.
BAD: below -1% would not be that surprising as it assumes 2-year average underlying trends that are similar to what we saw in October. Although I would typically consider maintaining 2-year average trends as a neutral result, I think a reported number below 1% (even if does not reflect true underlying trends) will hurt investor sentiment. MCD has not reported a monthly comparable sales decline of greater than 1% since March 2003.
Europe (facing +7.8% comparison from last year, calendar shift helped result by 0.0% to 2.8%):
According to a Reuters article, MCD’s Europe Chief Financial Officer Jerome Tafani said, “The trend in sales we have seen up until October is not going to change in the coming months.” Based on his comments, we would not expect to see a BAD result.
GOOD: +6.0% or better would imply that MCD is maintaining its strong 2-year average underlying trends from October, which accelerated sequentially from September.
NEUTRAL: +3% to +6.0% would point to 2-year average underlying trends that have slowed somewhat from October but are still even with to slightly improved from September levels. September 2-year average trends were up 6.0% so these are still good numbers, but I think MCD’s strength in Europe has trained investors to need 2-year average trends in the 7%-plus range to get really excited.
BAD: below +3% would imply a significant sequential slowdown in 2-year average underlying trends from October and a slight deceleration from September. A +2% or lower would be viewed as really BAD as it would signal a return in 2-year average underlying trends to the low reported June levels.
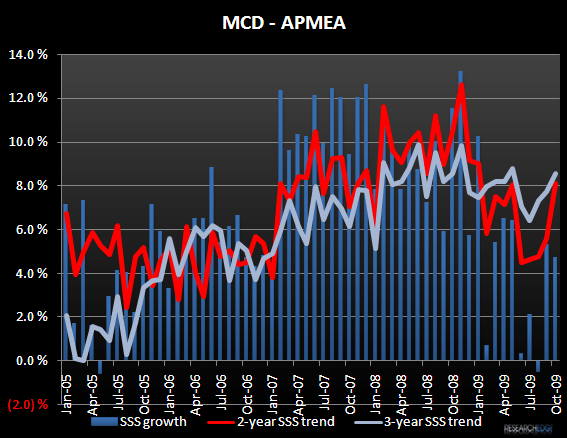
APMEA (facing a difficult +13.2% comparison from last year, calendar shift helped result by 0.0% to 2.8%):
GOOD: +1.0% or better would signal that MCD maintained its 2-year underlying average trends from October. Being that MCD’s APMEA trends accelerated rather significantly in October after having slowed somewhat for the four preceding months, I think just maintaining those 2-year average trends in the 7%-plus range will encourage investors that October was not just a one month uptick.
NEUTRAL: -1% to +1% would point to 2-year average underlying trends that are consistent with to slightly worse than what we saw in October. Although I don’t think investors are accustomed to negative results out of this geographic segment, the tough YOY comparison and the reported negative timing shift must be considered as a reported -1% number still implies 2-year average underlying trends in the 6%-plus range.
BAD: any number below -1% would imply that 2-year average trends have slowed somewhat from October which might lead investors to believe that October’s significant improvement is not sustainable.