
Source: RoadTrafficSigns.com
The big money in markets is often made by seeing what others don't. It's about resisting the gravitational pull of consensus, treading lightly where consensus is right, while spotting subtleties where the herd might be wrong.
Where Consensus Could Be Wrong: Volatility
#Volatility #ElectionDay
One subtlety we've been watching recently is volatility. Volatility, of course, is the measurement of the daily market fluctuations. In times of fear, the volatility of an asset rises. In times of buoyancy, all is well. The market simply floats higher and volatility falls.
We have a nuanced view of volatility here at Hedgeye. Conceptually, there are two types of volatility we're looking at, realized volatility (i.e. the volatility of an asset historically) and implied volatility (i.e. investors' expectations of future volatility that's embedded in options markets).
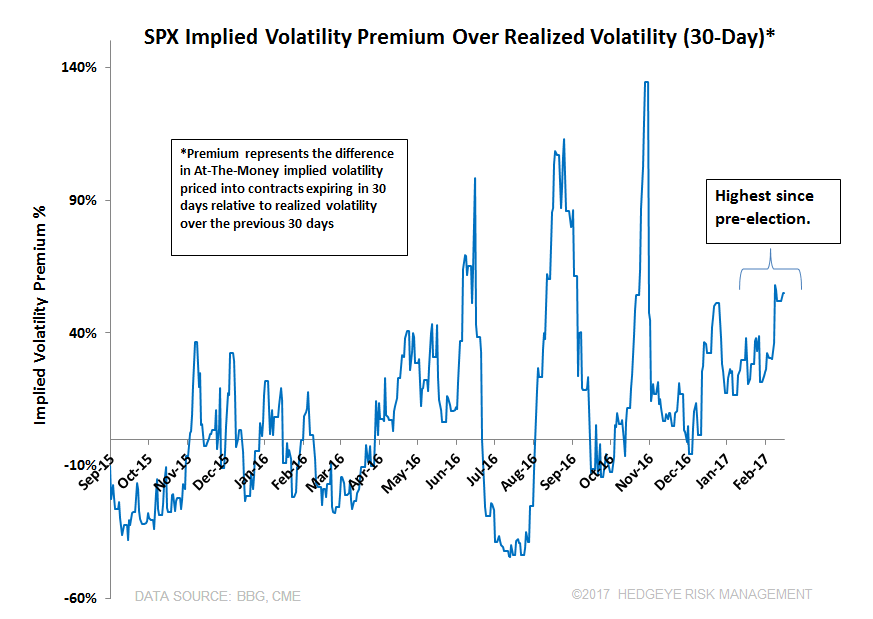
These volatility readings are painting a clear picture for investors today. As the stock market continues to make all-time highs, historical or realized volatility is falling to cycle lows. Meanwhile, fearful traders expect rising future volatility in the stock market and are buying downside protection in options markets to stave off the pain of an impending correction.
The Chart of the Day below from today's Early Look is a visual representation of precisely that. The S&P 500 implied volatility premium on a 30-day basis is 52.2%. That's a fancy way of saying investors are fearful of downside risks as historical volatility continues to fall. Note: A premium this high in the stratosphere hasn't been hit since before Election Day.
Where Do We Go From Here?
#Economy #RetailSales #Inflation
Investors must put this volatility measure in the context of where we're at in the economic cycle. Unsurprisingly, U.S. economic growth and inflation drive financial market returns. We believe both growth and inflation are accelerating.
Retail sales and inflation reports last week were near or above 5-year highs.
With this positive backdrop, we think equity markets can head higher from here. In other words, investors betting on significant future downside will get squeezed out of those positions.
It might actually be more risky piling into sectors like Consumer Staples (XLP) and Utilities (XLU), which are typically equity exposures investors buy when future downside is expected. In these sectors, implied volatility premiums are infinitesimal, 0.3% for Consumer Staples and 4.8% for Utilities. Implied volatility premiums this low suggest investor complacency.
Bottom Line
The prevailing market trends say stick with U.S. equities here.