We’ve been somewhat silent on natural gas in terms of the virtual portfolio this year. On the long side, we’ve been focused on those commodities that are global and priced in U.S. dollars – copper, oil, and gold. Natural gas is a local market and, therefore is priced based on local supply and demand dynamics.
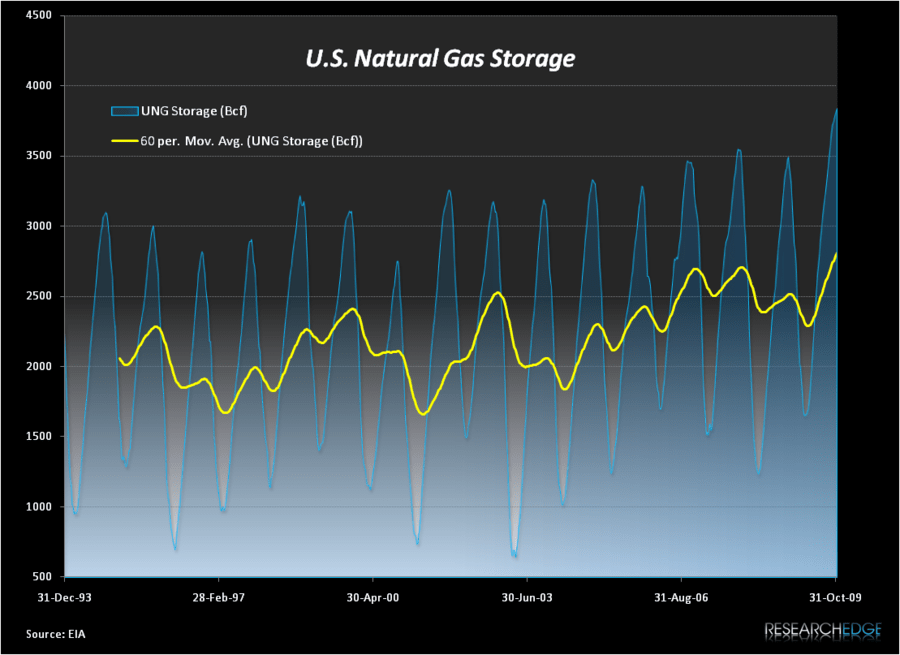
We were reviewing the weekly reports this morning from the Energy Information Administration and wanted to highlight one point relating to storage. There is currently more natural gas in storage in the domestic United States than there has ever been. And ever, as they say, is a long time. This point is highlighted in the chart below.
Technically it is not ever, but only as long as the data goes back, which is to 1994. As of November 13th, there were 3,833 Bcf in storage, which is the largest storage number recorded since the EIA began keeping the data and, obviously, well above the five year trend. This also represents a 10.0% YoY increase.
Obviously, what ultimately matters is the next data point and if we could make the case that storage will begin to decline, we could, on the margin, get more positive. Unfortunately, recent data points from large producers suggests just the opposite. Chesapeake Energy provided an operational update on October 29 and stated:
“For the 2009 third quarter, daily production averaged 2.483 billion cubic feet of natural gas equivalent (bcfe), an increase of 30 million cubic feet of natural gas equivalent (mmcfe), or 1%, over the 2.453 bcfe produced per day in the 2009 second quarter and an increase of 162 mmcfe, or 7%, over the 2.321 bcfe produced per day in the 2008 third quarter. Adjusted for the company’s voluntary production curtailments due to low natural gas prices and involuntary production curtailments due to pipeline repairs (which together averaged approximately 45 mmcfe per day during the 2009 third quarter), the company’s 2009 and third and fourth quarter 2008 volumetric production payment transactions (which combined averaged approximately 125 mmcfe per day during the 2009 third quarter) and the estimated impact from various divestitures (which would have averaged approximately 105 mmcfe per day during the 2009 third quarter), Chesapeake’s sequential and year-over-year production growth rates would have been 2% and 14%, respectively, after making similar adjustments to prior quarters.”
The company currently produces 2.286 bcf/day and operates 105 rigs. In terms of national rig activity, Chesapeake is currently operating 14.4% of all active rigs in the United States and is estimated to be the largest domestic natural gas producer. Clearly, the decline in rig activity we have seen year-to-date will have an impact on future production, but with storage at all time highs and the country’s largest producer, Chesapeake, forecasting 7% y-o-y production growth for Q3 (which would have been 14% if it hadn’t been for curtailments), it is difficult to be overly bullish on price with these production and storage overhangs.
Daryl G. Jones
Managing Director