
Skepticism and long volatility trades coming out of the election are being repriced after last week’s continuation of winning QUAD 2 macro exposures. Below we draw important conclusions from our daily monitoring of key pricing and sentiment variables, much of it derivatives-markets based. We publish key conclusions ~monthly in cohesion with shifting conditions.
We weigh these various indicators against our own fundamental and top down views to find opportunities where consensus seems to diverge from those said views. To the extent you're interested in a more technical discussion on how we think about capitalizing on the various set-ups ping us back.
Here are the most important conclusions we’re considering as the market digests the new year:
- With realized volatility in U.S. equity markets continuing to compress, implied volatility premiums have also started to compress on a relative basis – this is a new shift and similar to what we flagged back in August, although not quite as stretched. When volatility approaches extreme levels, and the market prices in an extended period of time at extreme levels, it’s worth a close look alongside our framework. History suggests a continuation in the current developing trend for an extended period of time is unlikely.
- We called out the implied volatility premium factor in currencies in our last published update back on 12/14 (A QUICK PULSE ). At that point, currency volatility, both real-time levels, and forward expectations were elevated more so on a relative basis than anything else globally. These expectations have been tamed over the last month, but overall levels of volatility expectations remain elevated nonetheless.
- Net Futures & Options positioning and short-interest in equity indices points to a consensus stance that is much more positive on the margin month-over-month. The short bias in the S&P 500 has been washed out and all sectors have seen a cut in short-interest as % float m/m.
- The most positive relative shift in volatility skews has unsurprisingly occurred in U.S. equity markets. Looking at a global screen, U.S. equity related tickers make up the top 6 with the biggest shift in skew to a more favorable view on the market (puts less expensive relative to calls in volatility terms). This shift in skew coincides with all surfaces shifting lower as a whole - hence the implied vol. premium factor mentioned above.
-----------
Compressing volatility and Implied Premiums
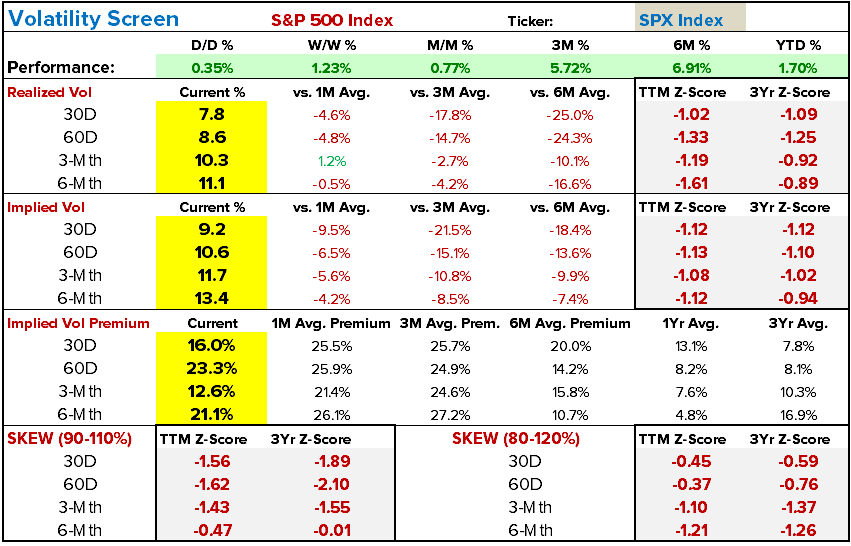
- Trading ranges in U.S. equity markets continue to compress. For example 30D and 60D volatility in the S&P is -25% and -24% vs. 6-Mth averages, with a similar trend across durations and indices.
- 60D realized vol. (since the election) is close to testing 2014 cycle lows, and shorter duration levels of volatility are close to breaching low single digit percentiles. A historical study of changes in volatility suggests current trends don’t typically last. The fourth table below shows a study of multi-duration changes in volatility once the 5th percentile is triggered.
- Perhaps most important recent change is that implied volatility has started to compress compared to declining realized levels. While the November and December move in equity beta was met with skepticism in derivatives markets (protection was priced at a large premium to tighter realized ranges), implied volatility has come-in at a faster pace recently. It’s a what’s happened vs. what’s expected comparison, and in typical fashion, the longer a trend continues, the more painful a position on the other side. In the first table below we show this shift in the S&P specifically, but this dynamic looks similar across the board in the U.S. For example, implied vol. of 11.7 priced into a contract expiring in 3-mths trades at a much smaller premium to 3-mth realized vol. than it has over the last 3 and 6 months. All-in-all consensus looks much more positive on an outgoing basis than even just a month ago.
Extreme levels of volatility are always a good flag for a second look, but for a more nuanced look at how we check the market’s pulse for identifying opportunities, we’ll use the example of large volatility premiums priced into U.S. equity markets in November and even into December. Our process moved us to the long side of equity beta out of the election which typically encompasses fading outsized moves with a bullish bias. With volatility at a premium, it becomes overbought when indices are oversold. Therefore taking the other side of volatility spikes with short-duration near the money strikes can have some beneficial gamma and time decay effects. So without a longer duration view on volatility or the underlying, often opportunities arise in the daily chop. However these set-ups eventually wane as consensus comes around. Hope this helps explain the process.


Equity Market positioning
- Month-over-month, short-Interest as a % float has been cut in every sector but materials where it was flat.
- The market remains bullish on the RUSSELL 2000, and a big shift over the last month is a washing out of S&P 500 speculative short positioning (net non-commercial futures and options positioning from the CFTC) – The market has moved from short 127K contracts to long 81K contracts. However the current positioning in S&P derivatives is by no means stretched. The second chart below is a global screen of extended positioning, where the big consensus shorts are on across the treasury curve and in the YEN.


Volatility Skew
- Not only has implied volatility compressed (volatility surfaces shifted lower), the shape is much less skewed in most equity-related indices and ETFs, meaning puts are much less expensive relative to calls.
- U.S. equity related indices and ETFs make up the top 6 with the largest declines in skew (red bars in the chart below). The table aggregates the skew of 90-110% strikes across four different option expiry durations (30D/60D/3Mth/6Mth). This shift can also be seen in the S&P 500 as an example in the first table in the note. The Z-score readings in that table which track relative changes, are a sea of red.

Again, let us know if we can explain anything in more detail. We’re happy to reach out to provide more color as we continue to refine the communication process.
