by Mike O'Rourke, JonesTrading

We started highlighting the trend towards “Blind Buying” back in 2013 and over the course of 2016, the trend reached new heights. In general, we are referencing behavior in which individual stock analysis plays little or no role in the investment process. In short, equities are purchased for exposure to the asset class as opposed to purchasing a company’s shares based upon the individual growth and value prospects of its business.
While the strategies come in many forms – asset allocation, automated, correlation driven, factor driven, social media driven – none has been more influential than the shift away from active investing towards passive investing. That has become one of the key themes of the market over the past year.

It was three decades ago when the seminal research by Brinson, Hood and Beebower was published indicating that asset allocation is the overwhelming determinant of returns in comparison to market timing and stock selection. Over the past three decades, this point has been debated countless times.
Subsequent research has noted that the high correlation reported is the result of “aggregate market movement,” i.e. they are all invested in stocks. This is often referred to as the "rising tide lifts all boats" argument.
The 9-Year Bull Market: Active vs. Passive Funds
Regardless, there are numerous arguments and examples of passive funds outperforming active funds. One can understand how those arguments have reached a fever pitch as we head into the ninth year of a bull market, a bull market that has been fostered by unconventional accommodative policy.
This is a policy that has included 9+ years of one or more major central banks always buying assets and concurrent zero or near zero interest rate policies. In such an environment, it becomes very easy to outsource the decision making and let the market (and the central banks) do all of the work.
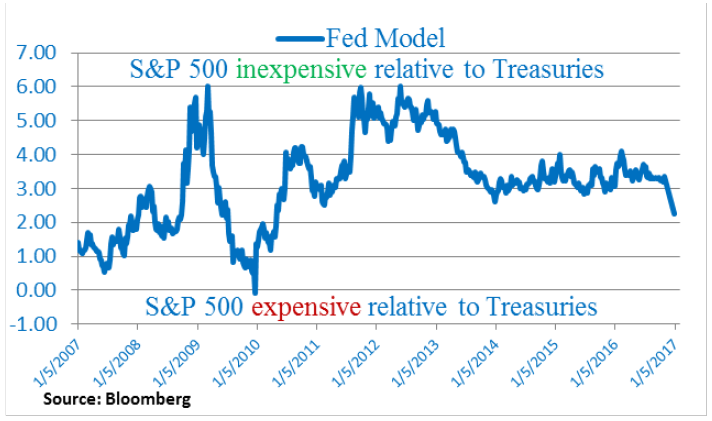
It is a one size fits all approach. The leading rationalization behind riding the rising tide has been the fact that equities are “relatively” inexpensive in comparison to Treasuries (which are very expensive), even after the bond market selloff over the past 6 months.
Interestingly, that Fed Model relationship moved dramatically during the Treasury selloff and equities are now the most expensive they have been versus Treasuries since 2010 (chart below), which is the year earnings began to recover.
Considering both stocks and bonds are very expensive, comparing them to one another is a dangerous proposition. A more realistic approach is to measure how expensive stocks and bonds are together - relative to history. One can add the S&P 500 earnings yield and the 10 year Treasury yield, essentially inverting the Fed Model.
One can go one step further and multiply the S&P 500 earnings yield by 60% and the Treasury yield by 40% to create the theoretical historic valuation for a 60% equity/40% fixed income portfolio mix (chart below). The readings for both metrics over the past year, especially the past 6 months, rank in the most expensive percentile of readings dating back to 1962.
Why do active managers exist?
They exist so investors can differentiate their returns. In different environments, different stocks, industries, sectors and assets perform better than others. When the two main assets reach their most expensive levels in 56 years, one can understand why investors are not looking to differentiate.
Furthermore, the static monetary policy environment that is almost a decade old has accentuated and elongated this trend. When policy is static, investors don’t need to worry about how policy will influence their holdings and “one size fits all” appears to work.
When monetary and fiscal policy change and the static environment comes to an end, investors will once again need to look to differentiate. Apparently, this is not happening overnight, but as each gradual shift occurs, the gradual pressure will grow into an unsustainable weight.
Since inflation has been rising for over a year and it’s on pace to continue, now is not the time to argue that low inflation justifies a higher multiple. Many will be caught off guard because it has been way too easy to “set it and forget it” in recent years.
Bottom Line
The psychology associated with simply being invested in the “market” has become so pervasive that it is reminiscent of the 2005-2006 housing bubble arguments that “US Home prices have never declined year over year” - until they did. One size fits all makes sure you are wearing something, but it may not be the right thing.


EDITOR'S NOTE
This is a Hedgeye Guest Contributor research note written by Michael O'Rourke, Chief Market Strategist of JonesTrading, where he advises institutional investors on market developments. He publishes "The Closing Print" on a daily basis in which his primary focus is identifying short term catalysts that drive daily trading activity while addressing how they fit into the “big picture.” This piece does not necessarily reflect the opinion of Hedgeye.