10-K Review
The DE 10-K reinforces our view that DE management is betting on a FY17 market recovery, and will need to lower guidance mid-year. We suppose that makes sense from their position: why take pain up front, when it might be avoided altogether. There appears to be market anxiety throughout the 10-K, everywhere except in guidance. If the underlying trends in DE’s performance don’t concern investors, perhaps nothing will. We continue to see DE building an unsupported cost narrative, by relying on accounting changes, its balance sheet, and finance subsidiary to manufacture the results. The complexity of the annual report is stunning, which should typically concern investors in a reasonably straightforward manufacturing company.
Consider some odd factors that should raise questions right away.
- Why is the balance sheet line item Inventories down nearly $500 million, but cash flow flows from inventories is negative $106 million?
- What are the trends in leases, which largely explain that inventory to cash spread, and how much inventory from matured leases is sitting on DE’s balance sheet?
- What are the trends in past dues, and do they portend another finance company income guidance miss?
- Why is square footage increasing and revenue per employee dropping sharply, if management is executing structural cost reductions?
- Where were the favorable decrementals in the equipment segment, and how much did a South America pre-buy impact sales?
- Should investors really view this cycle as better executed than the 1980s analogous decline?
For us, the answer to each of these questions reinforces our view that DE is stretching reality in its FY17 guidance, and left itself plenty of wiggle room in the underlying assumptions to drop the bar later in the year. While we got the initial FY17 guidance wrong, we do, in fact, like the short more at current prices. DE is a name held on faith in a management team that now needs an ag equipment rebound. We don’t see a rebound coming, as the fleet is the youngest since the late 1970s, farm equity is falling, crop prices are lower year-over-year, and real equipment spending is still elevated. Instead, this management has put shareholders at risk by implicitly writing puts on used equipment (leases), buying shares near the cycle peak, and loading the balance sheet with dubious finance assets.
Finance Subsidiary
One of our main contentions is that DE investors are applying a trough multiple to earnings from a near-peak finance subsidiary, and that the finance subsidiary should be valued on a multiple of book. We expect the costs of deteriorating credit to hit Deere’s profitability on a lag, even though the ‘pig’ is already visible in the ‘python’. Investors need to ask why DE is placing so much equipment with leases, and if DE is more broadly underpricing equipment financing in a period of deteriorating borrower credit. Or at least we think they do. The trends are far from subtle.
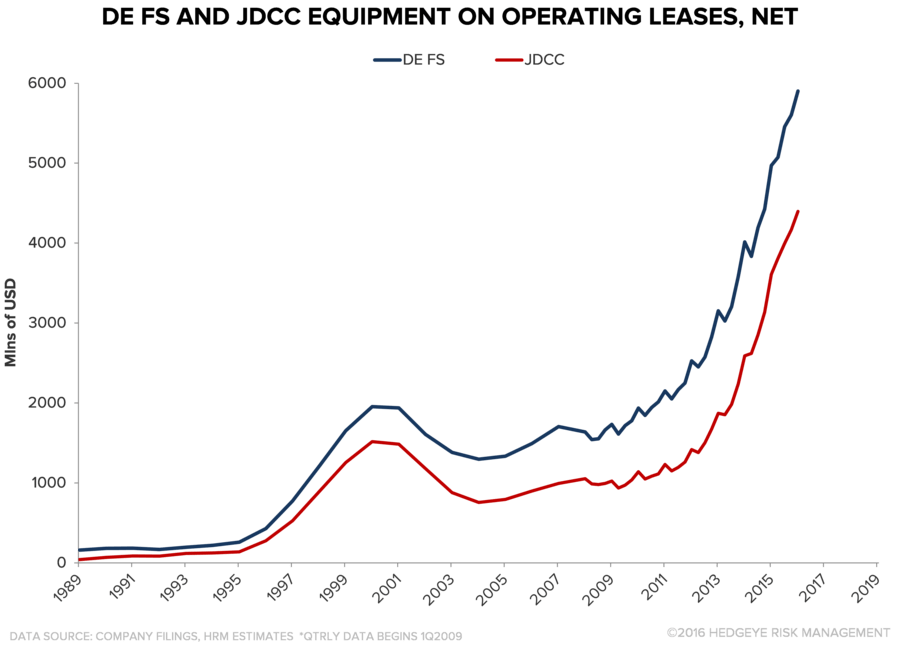
Total Leased Equipment: The value of Deere’s leased equipment has moved sharply higher, facilitating equipment ‘sales’ and giving the lessee a put option on the used equipment value. We think Deere may come to regret writing so many options, and suspect they are mispricing the terms – a reason why buyers like the total deal.
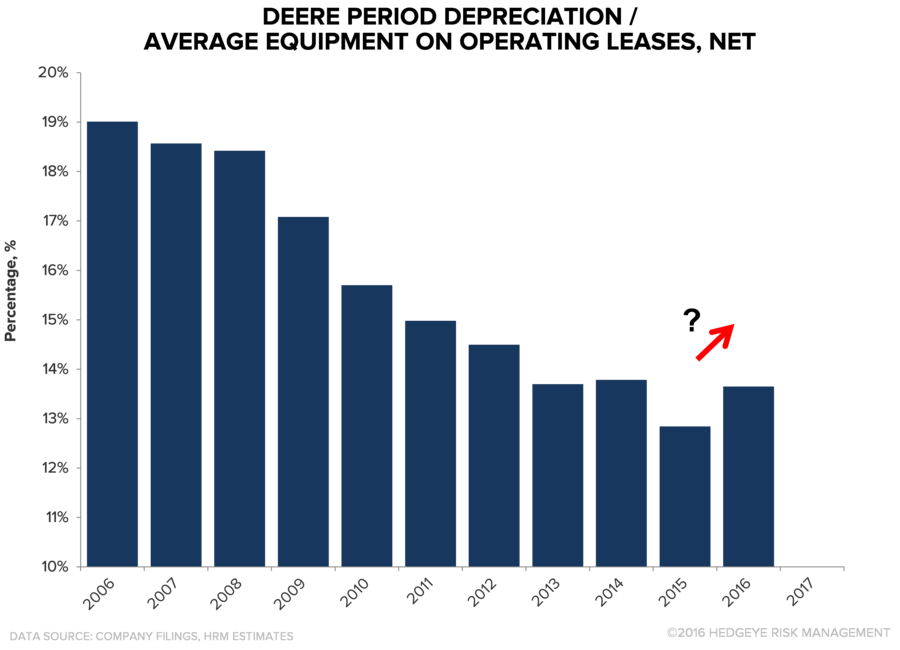
Depreciation Expense: Declines in the Depreciation expense as a percent of the book value of leased equipment had been a sizeable earnings tailwind, despite falling used equipment values and fairly constant lease duration. Recent impairments of off-lease equipment suggest depreciation expense may turn to a sizeable headwind, as each percentage point is ~$60 million of annual finco operating income.
Cheap Leases? We suspect that the declines in leased equipment payments contributed to the attractiveness of leasing equipment, basically lowering future finance income and increasing financing risk to support equipment pricing. Easing finance charges were a hallmark of DE’s early response to the 1980s farm equipment downturn – a choice that was later costly.

Higher Residual Values: The discounting of leases can also be seen in what may prove unrealistic assumptions for the residual value of equipment off lease. This is odd as large used equipment price declines have already been observed since around 2013, and DE has taken charges related to used equipment off lease.

Impaired & Past Due Leases: While the FY17 guidance seems to imply FY16 will be the worst of the lease issues, we suspect accumulating off lease inventory is sitting in the ballooning ‘Other asset’ balance sheet line.

Off-Lease Equipment, Or Lessee Exercising Put Option: The JDCC 10-K discloses $184 million of off-lease used equipment that was tested for impairment as a Level 3 asset. Of that, $31.1 million, or ~17% of the value was impaired. That is nearly double the prior year’s $96.2 million, and it isn’t discussed why that off-lease equipment is different from all of the other equipment that will be coming off-lease. This is also just the Level 3 assets, and is only JDCC, not all of DE. Further large increases in equipment from matured leases seem likely given the trajectory of total lease values and our understanding of market trends. The line on the chart below would likely have moved higher without the impairments.

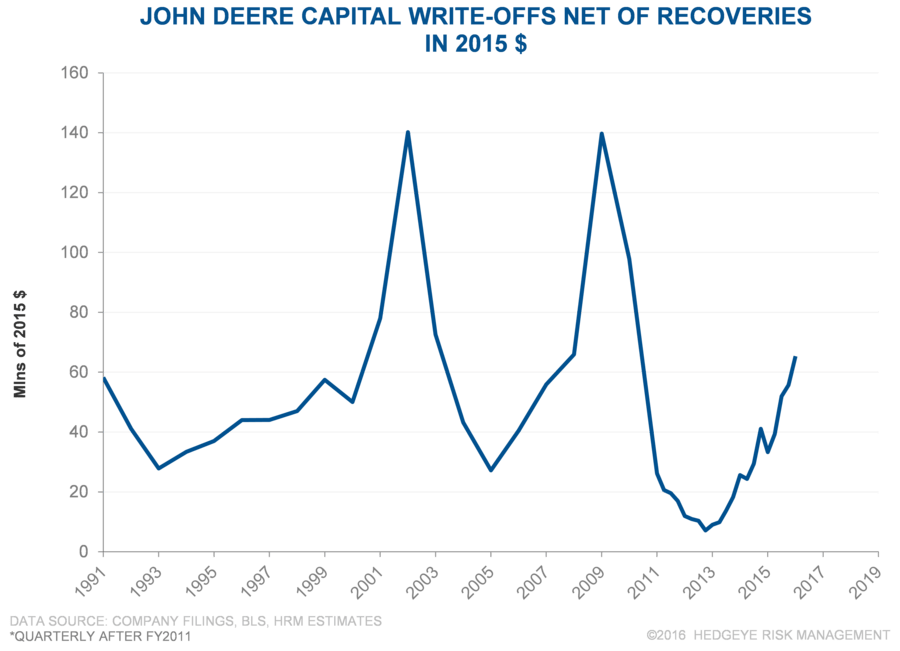
Write-Off Net Of Recoveries: Write-offs and Troubled Debt Restructurings both helped to stem the tide of rising past dues, but the trajectory in costs does not match the credit cost provision, in our view.
Past Dues: Past dues across metrics are much higher than a year ago, a trend we expect to see continue. A ramp in troubled debt restructurings and write-offs helped to slow the increase in FY4Q16, by our estimates. The allowance for credit losses is lower than it was at the end of 2014, when past dues were far lower.

Finance Income Guidance Looks High: In addition to higher credit and depreciation costs, funding costs appear higher and the portfolio is shrinking somewhat. Last year, DE cut its Finco net income guidance substantially and we see a likely repeat in FY17.

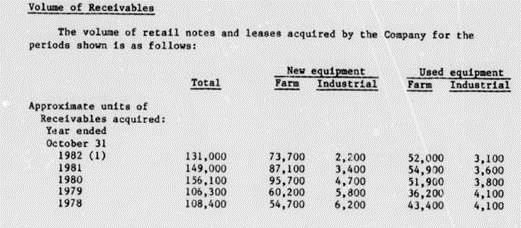
A History Of Abuse? If investors do not this DE would use underpriced credit to facilitate unit sales, they should consider this from 1982 JDCC 10-K.

Stepped on Financing Gas: It is also worth considering the unit sales financed during a time when industry sales were dropping sharply…
Faux Cost Cuts?
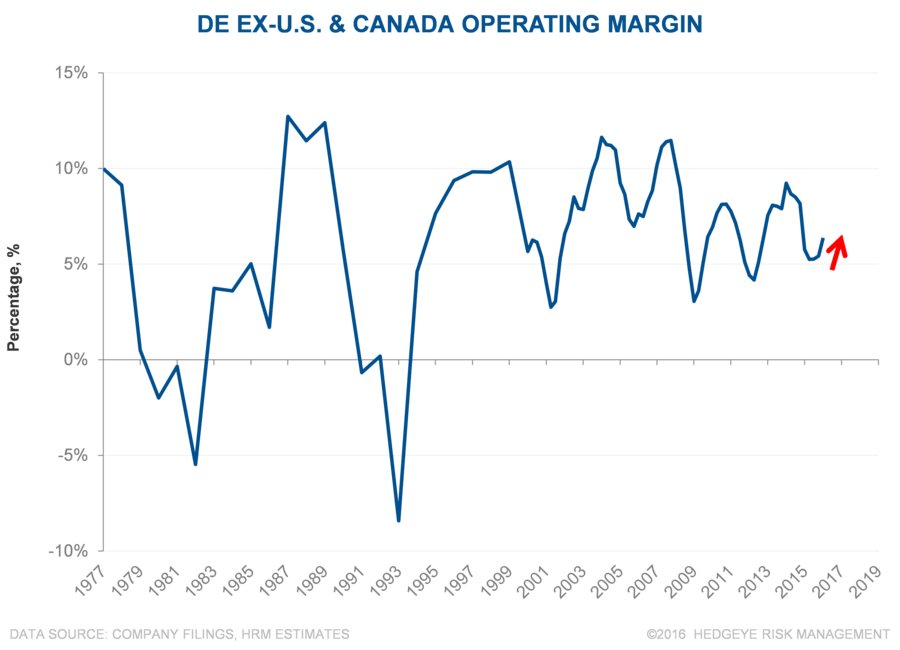
We continue to believe that the favorable decrementals at Ag & Turf relate more to cheaper credit provision, lower steel and other input costs, changes in pension accounting ($175 million year-on-year benefit disclosed in the 10-K) and other non-operating factors. Many industrials have benefited from similar trends, but most don’t pretend that they are structural. Presumably, DE wants investors to believe that there was waste ready to be engineered out of the products. Unfortunately for longs, the data in the 10-K do not support structural cost reductions. It is worth noting that the, agricultural equipment margin in 1982, three years after the peak in 1979, was around 6.8% - not far off what DE has reported in this cycle. It was the duration of the downturn in the 1980s, exacerbated by the ready provision of credit, which hit DE hard as time went on. This cycle is not as different as investors think, in our view.
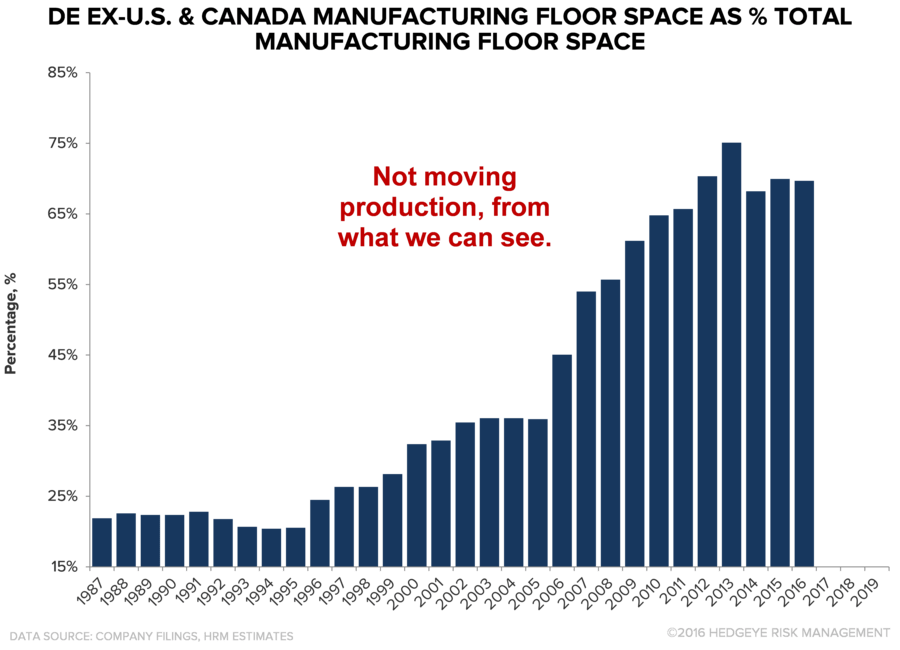
Square Footage: If DE were cutting manufacturing costs, why is the footprint increasing? We had understood that utilization was less than 50% of manufacturing capacity in some of their large AG facilities, so why the extra space?

And it does not appear to be from moving facilities to low cost regions…
Headcount Not Keeping Pace: While we do see some headcount reductions, those cuts are not keeping pace with the decline in sales.

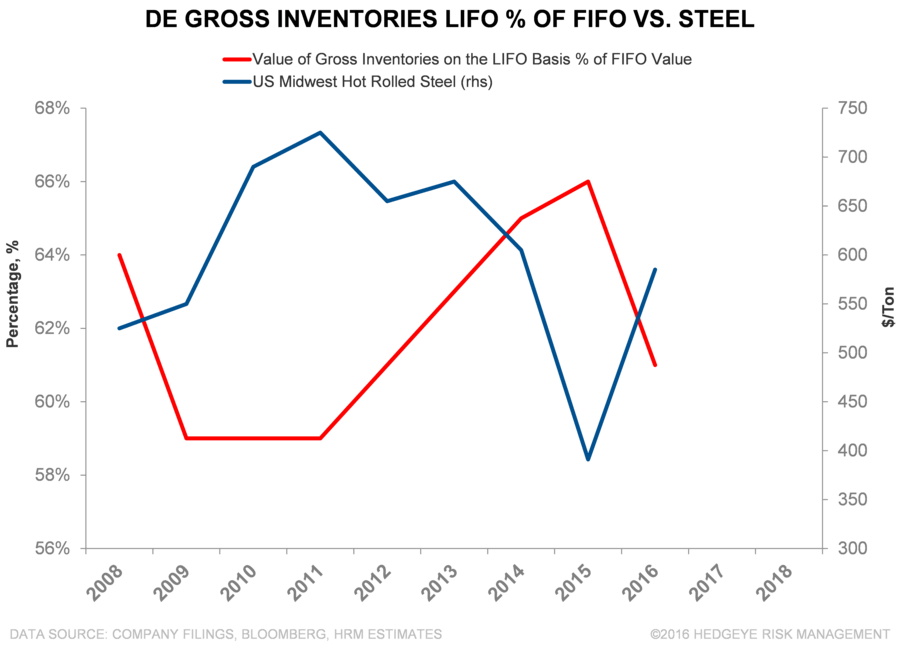
Steel Prices Look Set To Reverse: To assume that steel wasn’t a tailwind is to assume that DE doesn’t buy steel and other commodities…
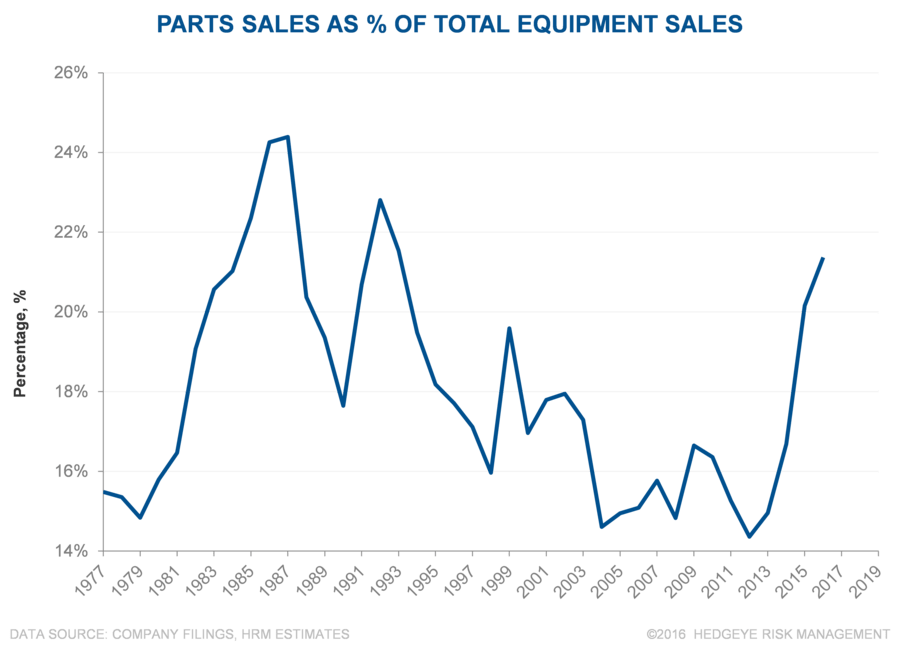
Falling Parts Sales: We continue to see declines in aftermarket parts sale, but…..

Parts Should Be Helping Mix: To the extent that aftermarket tends to have higher margins, we would expect this mix shift to account for some of the favorable decrementals.
Best Decremental Outside of Canada & U.S.: On a geographic basis, we see the driver in the Ex-US and Canada results. We suspect that an emissions pre-buy in South America was helpful.

It Isn’t Trough: Perhaps the best evidence of this is that the fleet is very young, suggesting that recent sales values haven’t been below replacement demand. Troughs coincide with old fleets, not young fleets.

Decremental Trough & The Bull Story Peak: We have discussed DE with a large number of investors since the last report, and the cost program of management is a key bullish factor. We think it is not supported by the operating data, and is better explained by lower steel costs, pension accounting changes, and incentive compensation cuts (which is likely increase again, like it did in 2010).

Upshot: There is a substantial amount of new data and disclosures in the DE and JDCC 10-Ks. We haven’t hit on all of them, such as trade concerns around the change in administration. We believe the trends in the finance subsidiary point to lower finance profits and ongoing, high risk support for the equipment operations. We also believe that the only trough DE is likely to experience is in its decrementals, as key operating metrics are not supportive of structural cost reductions. We expect DE to lower its back end loaded guidance during FY17. The company’s efforts to fight the agricultural equipment cycle may prove very expensive for shareholders.
Feel free to ping us for a full discussion in our prior black books, most recently in November, and updated EQM model/dataset.
