With yesterday’s Small Business Confidence data and this morning Retail Sales, Industrial Production, PPI and Inventory data, we’ve received a rash of consequential domestic macro fundamental flow over the last 24 hours.
Below is a quick data review along with the summary contextualization and relevant implications:
NFIB Small Business Confidence
THE DATA: Small Business confidence rose +3.5pts in November, taking the headline index to its highest level since December 2014. Notably, sales expectations rose +10 pts sequentially while the Forward Outlook/Expectations series jumped +19 pts sequentially, marking the largest sequential increase since 2009.
THE DISTILLATION: With the Conference Board’s Confidence Series making a new cycle high in November, the University of Michigan Confidence reading up a cumulative +11pst since October and the NFIB and Fed Regional Survey measures gapping higher, Trumphoria has been pervasive in the post-election Consumer and Business Confidence.
As we’ve highlighted, whether resurgent optimism proves a durable phenomenon or manifests in a sustained inflection in domestic consumerism or business investment (post-inauguration) remains to be seen but gross dismissal of step function changes in key indicators is rarely prudent risk management in reflexive Macroeconomies – particularly when emergent mojo in reported fundamentals is corroborating.


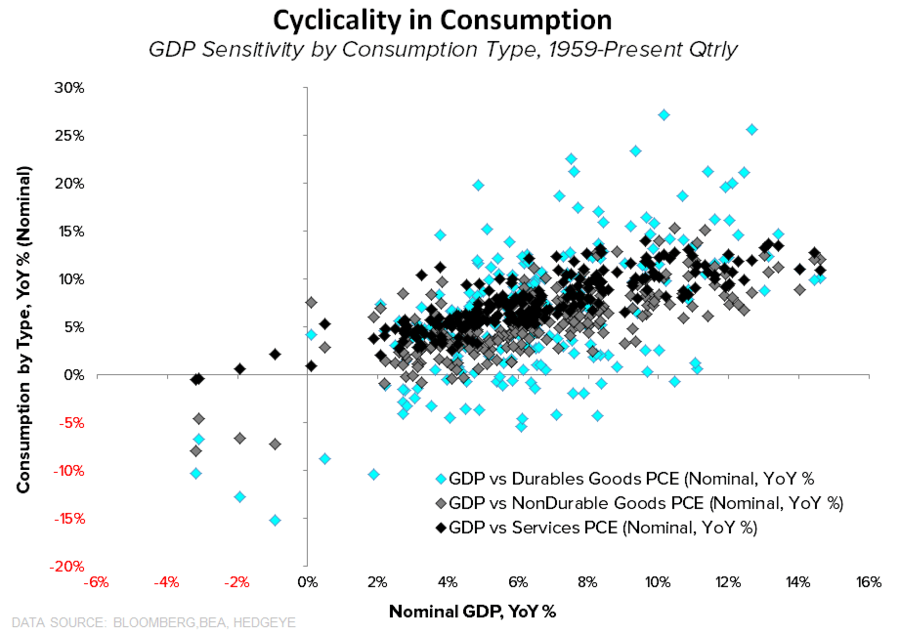
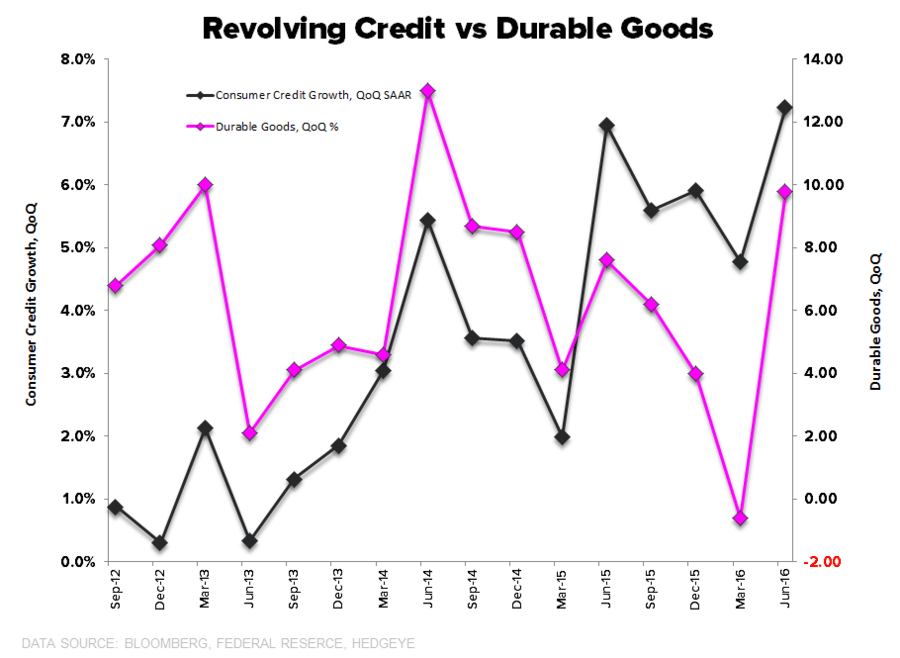
TEA-LEAFING TRUMP: Goods consumption is the most cyclical component of household spending with durables expenditures showing the largest sensitivity to macro and credit conditions. The increase in consumer confidence is notable in light of the fact that durables consumption has emerged as a relative support to Total Consumption growth. Further, revolving credit growth remains near cycle highs as of the latest October data and growth in durables and growth in credit card spending are strongly correlated.
The intuition is fairly straightforward:
Confidence ↑ --> Credit Growth ↑ --> Durables/Higher-Ticket Discretionary Consumption ↑ --> Total Household Spending ↑ …. thus, durables consumption serves as a decent barometer for the collective state of domestic consumerism.
It will be interesting to watch the interplay between confidence, credit and durables expenditure in the coming months.
![]()
RETAIL SALES
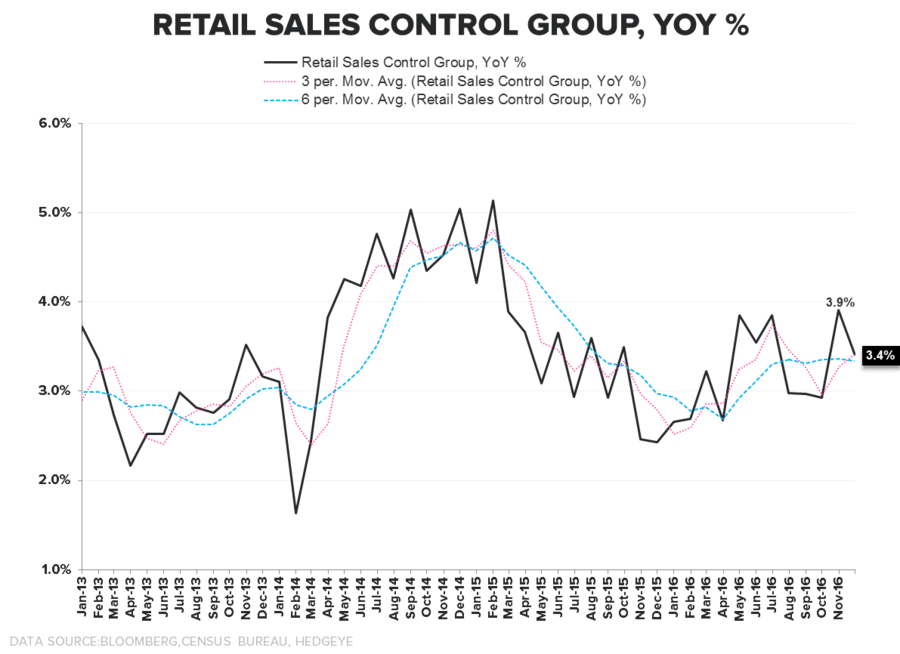
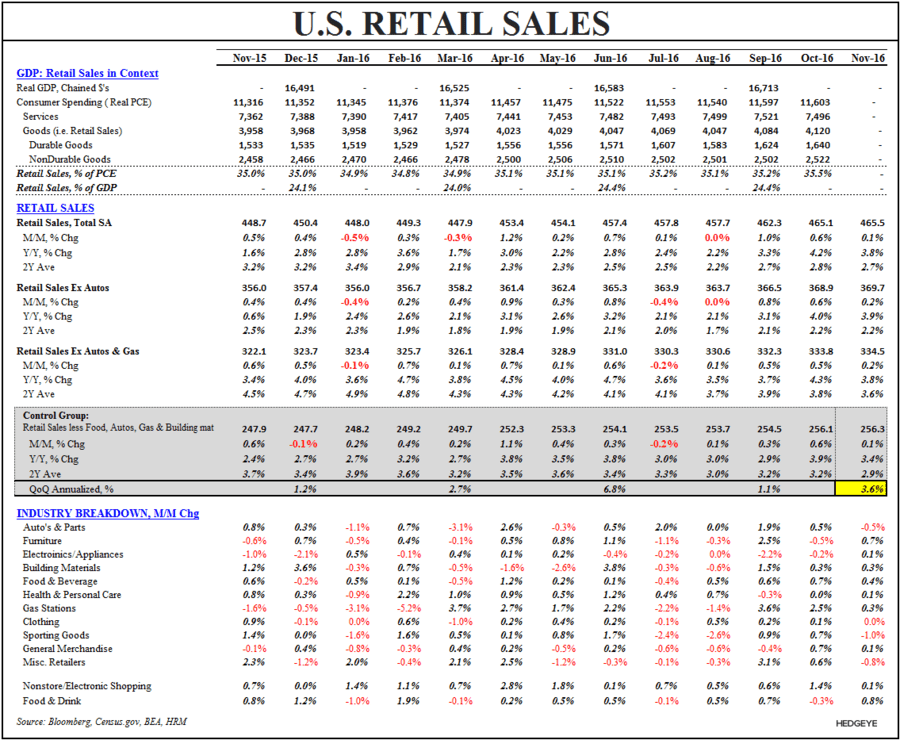
THE DATA: Both Headline and Control Group sales rose +0.1% MoM in November alongside a negative -20bps revision to October. On a year-over-year basis, sales growth across both aggregates in Oct/Nov is accelerating relative to 3Q16. From a GDP accounting perspective, Control Group sales in 4Q are currently tracking +3.6% QoQ annualized (compared to 1.1% realized in 3Q16).
THE DISTILLATION: Retail Sales (household spending on goods) represents ~35% of total consumption and ~25% of Total GDP and provided relative strength to Total Consumption growth in the October data. There are a few implications from this morning’s data:
- Goods Consumption is accelerating relative to 3Q but the net impact of the November data and negative October revision will be to shade consumption growth estimates modestly lower.
- QoQ: Services consumption will have to see a positive revision to October and/or strong Nov/Dec growth in order for Consumption to maintain a similar contribution to headline growth as that observed in 3Q16. As it stands, Total PCE needs to grow ~0.3% MoM, on average, in both Nov/Dec to remain a similar support to GDP in 4Q.
- YoY: On a year-over-year basis, consumption growth is likely to show modest-to-moderate acceleration in 4Q. With NFP data (aggregate hours growth + earnings growth) suggesting a deceleration in aggregate income growth in November, the savings rate will have to show some retreat and/or credit growth accelerate to drive an acceleration in consumption growth in November.


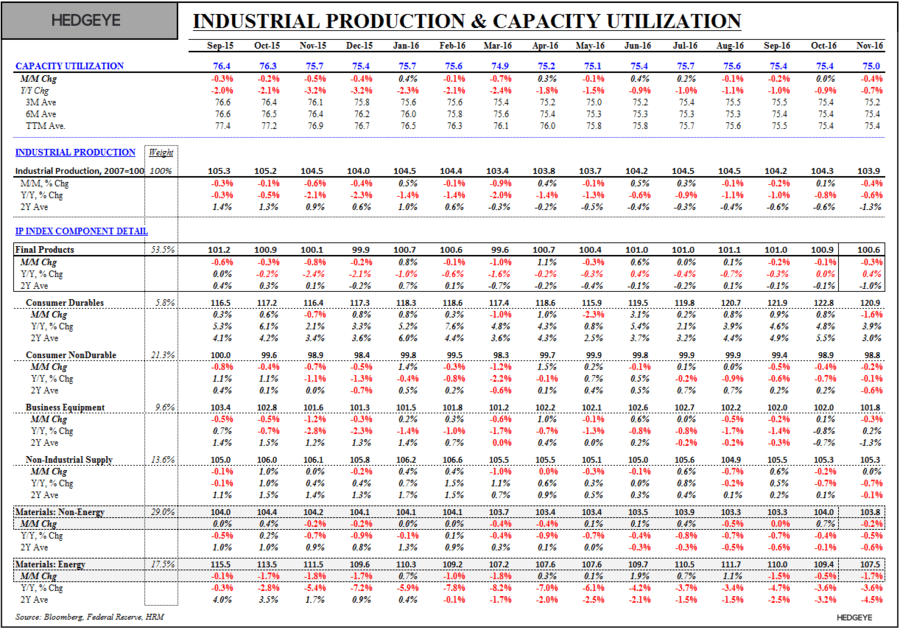
INDUSTRIAL PRODUCTION
THE DATA: Industrial Production fell -0.4% sequentially while improving to -0.6% YoY, marking the 15th consecutive month of negative year-over-year growth and extending the longest non-recession streak of negative growth ever.
THE DISTILLATION: The month-over-month decline was unsurprising as the NFP data (Mfg employment + Mfg hours worked) provide a solid lead read on industrial activity and were signaling sequential softness in November. The callout, however, is probably that November represented a 3rd month of ‘less bad’ from a rate of change perspective and next month sits as the easiest comp of the present cycle. Sequential growth in December (only) has to be +0.18% to get YoY growth back to the zero line and represents the highest probability of ending the epic run of recessionary industrial activity.

PPI
THE DATA: Headline PPI accelerated +50bps sequentially to +1.3% YoY (highest since Nov ’14) while Core Producer Prices accelerated +40bps sequentially to +1.6% YoY (highest since Jan ’15).
THE DISTILLATION: That both reported and expected inflation are rising is a trivial point. With PPI growth in China continuing to accelerate and broader price growth in Europe showing some nascent mojo, we expect the nearer-term domestic price data to extend the current trend.
BUSINESS INVENTORIES
THE DATA: Inventories fell in October as flat growth in manufacturing inventories and -0.4% declines at the retail and wholesale levels drove a -0.2% decline in the aggregate.
THE DISTILLATION: As we’ve highlighted, prior to 3Q16, inventories had delivered a negative contribution to growth for 5 consecutive quarters, marking the worst streak in 60 years. The reversal was not particularly surprising but also not particularly sustainable. One could argue that with sales growing at a premium to inventories in recent months it sets the stage for resurgent inventory investment but the early data suggest the more likely outcome is that inventory investment fails to show repreat strength in 4Q from a GDP accounting perspective. The same is true for net exports as the agricultural products/soybean bonanaza that supported 3Q reverses in the current quarter.


Christian B. Drake
@HedgeyeUSA