The leg higher in U.S. equity markets in 2016 came by way of multiple expansion next to margin contraction off peak 2014 levels. After 5 consecutive quarters of negative comps for the S&P as a whole, some sectors are set-up for a notable step-up in margins and earnings power based on consensus expectations (some with straighforward easy comps).
An early look at Q3 shows that earnings have come in positive Y/Y for the S&P, Nasdaq, and Dow and negative for the Russell 2000. While it’s still too early to get an accurate read on where earnings will shake out on the whole, the more recent 3-Mth pullback in forward multiples has been driven in part by last price but also much more positive earnings expectations across the board, maybe in part to counter the multiple expansion.
Forward-looking earnings expectations, whether looking at blended or next 4-qtr estimates, have been up on a rope since the start of Q2 with commodity reflation. However, we would question the late-cycle optimism embedded in every sector over the next 12-24 months aside from commodity reflation’s contribution (mostly energy assuming it lasts which we won’t discuss here) to the recovery in expectations – Below we outline this debate.
----------
Here are some key highlights to keep tabs on as reporting season shakes out:
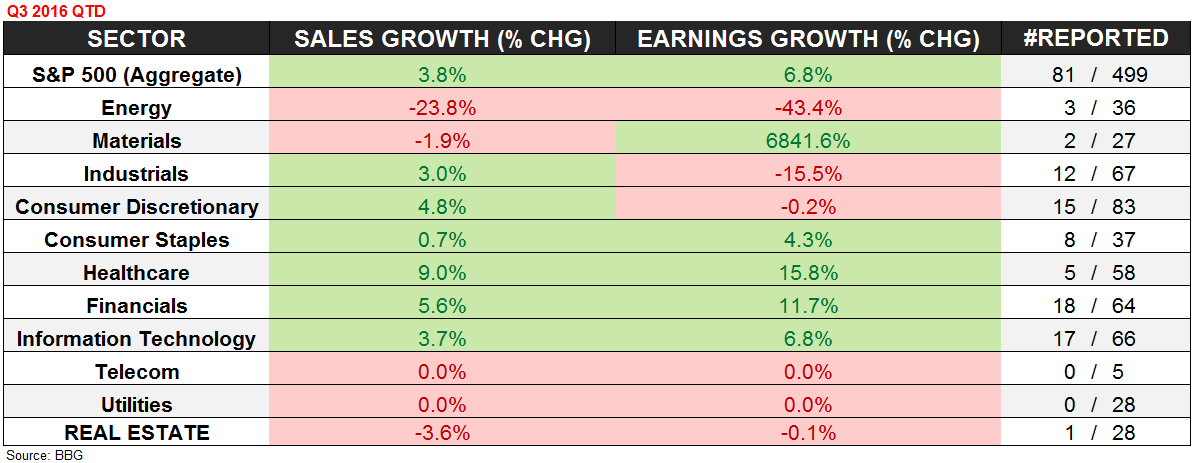
1) An early look at earnings points to positive YY growth so far, but the industrials sector, which we added again as an active short idea into Q4, has comped down -15.5% after 12/67 have reported, reiterating our #Double Dip theme (See our themes deck for details). The downturn in deep cyclicals remains ongoing.
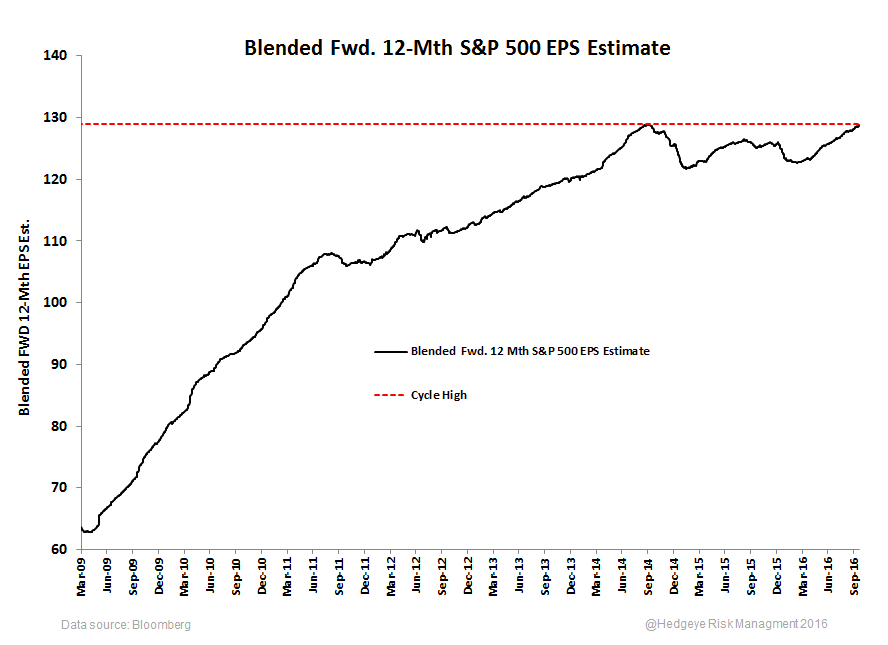
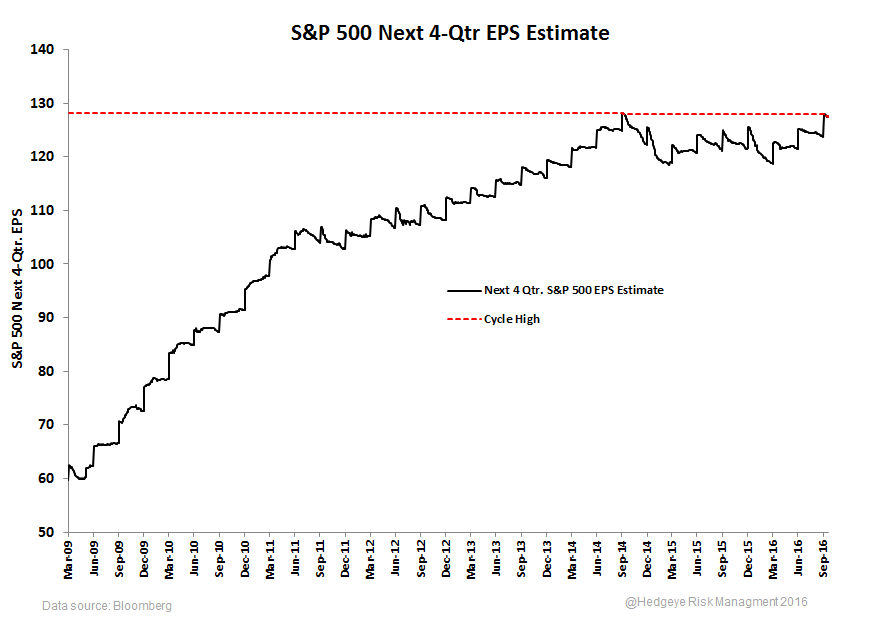
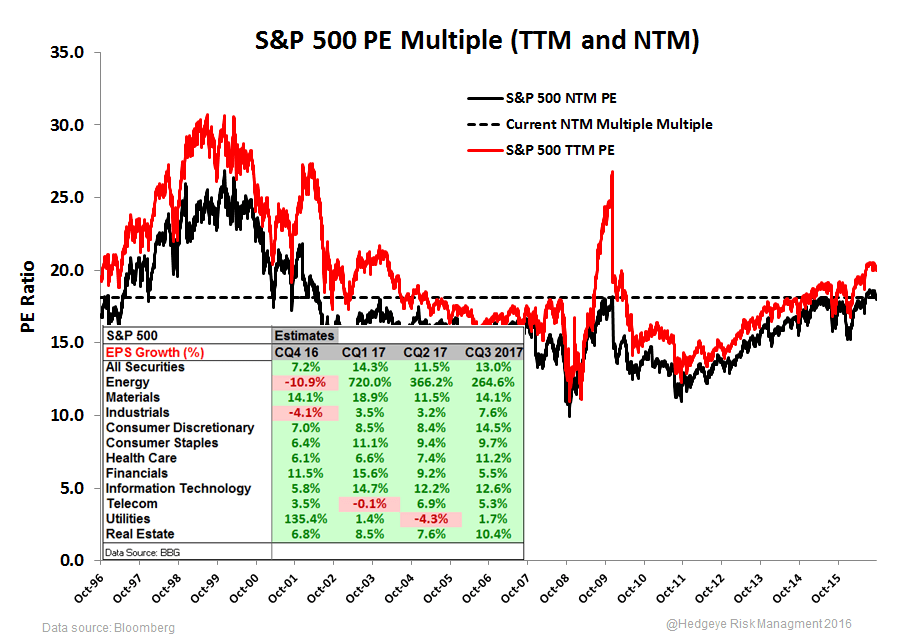
2) A recent move off of the cycle peak forward multiples has been helped by growth expectations in every sector. Blended forward and next 4 qtr. EPS estimates for the S&P are right at all-time high levels from October 2014 right as the USD began its breakout and the S&P traded below 2000.
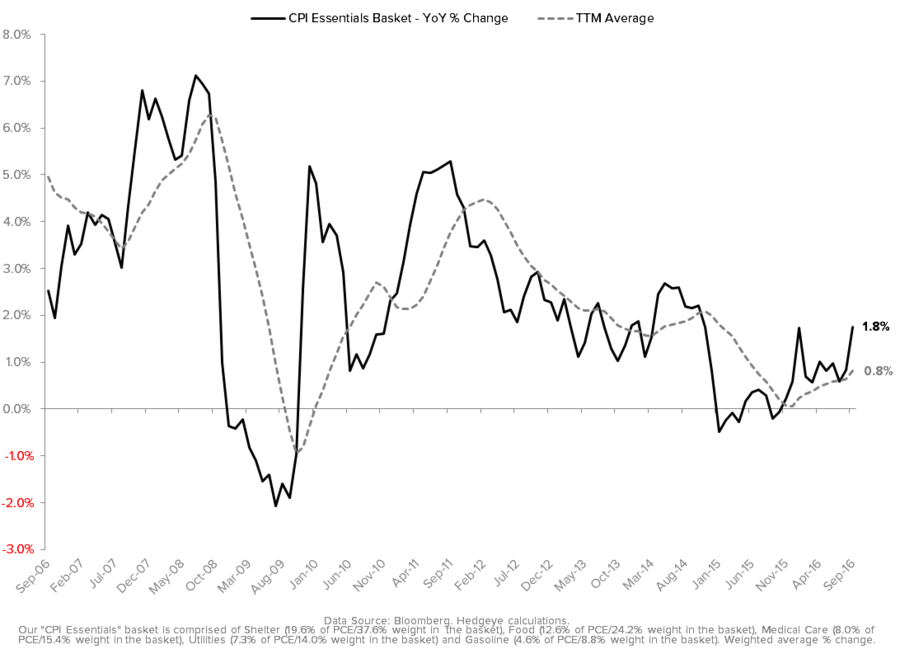
3) Looking at growth expectations, even if the average intra-quarter revision trend is considered with estimates, earnings growth still steps up meaningfully from here in every sector. Estimates are up on a rope since starting Q2 and we will continue to hash out commodity reflation’s contribution to the estimates vs. the economy’s capacity for broad-based earnings growth and margin expansion capacity. Energy prices are a tailwind for some and a headwind for others, but higher prices can’t be good for every sector’s bottom line. It looks like “transitory” was a term only used on the way down. In a note on Monday, We called out the highest delta in our proprietary CPI essentials basket since late-2014. The basket is comprised of shelter, food, medical costs, utilities, and gasoline (weighted for its share of the median consumer’s total expenditure basket). This inflection is meaningful given the consumer credit and labor market headwinds we detailed in our Q4 themes presentation (highlighted below).
-----------
The scorecard table below hopefully provides an easy-to-digest look at sales & earnings comps, forward-looking expectations, multiples, and margins by index and sector:

- An early look at earnings points to positive YY growth so far, but the industrials sector, which we added again as an active short idea into Q4, has comped down -15.5% after 12/67 in the S&P have reported, reiterating our #Double Dip Theme (See our themes deck for details)
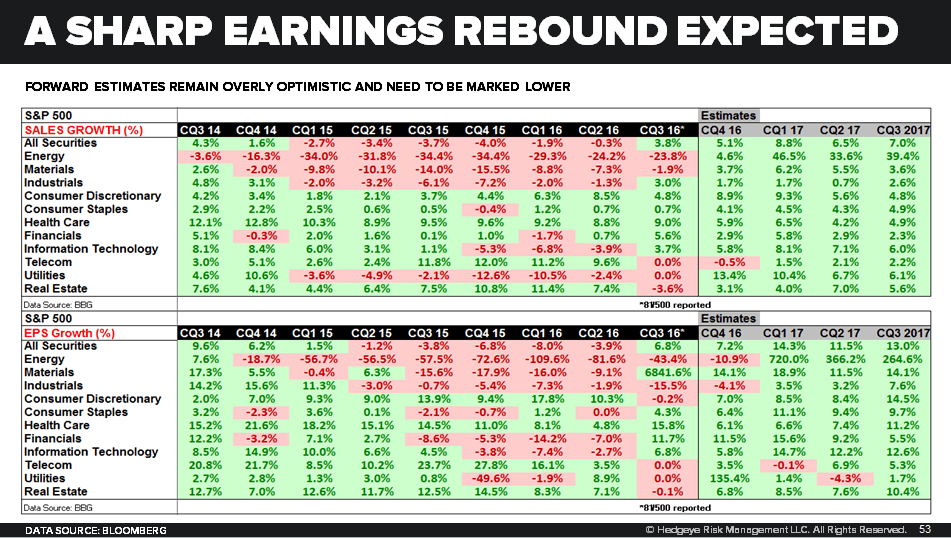
We track the rate-of-change trends here so a continuation in current Q3 reporting trends will be meaningful independent of estimates and beat/miss dynamics, but in the second table below we show forward-looking expectations which are a sea of green through 2017.
- A recent move off of the cycle peak forward multiples is a combination of last price but also margin expansion expectations. Blended forward and next 4 qtr. EPS estimates for the S&P are right at all-time high levels from October 2014 when the S&P traded below 2000 without the same multiple.
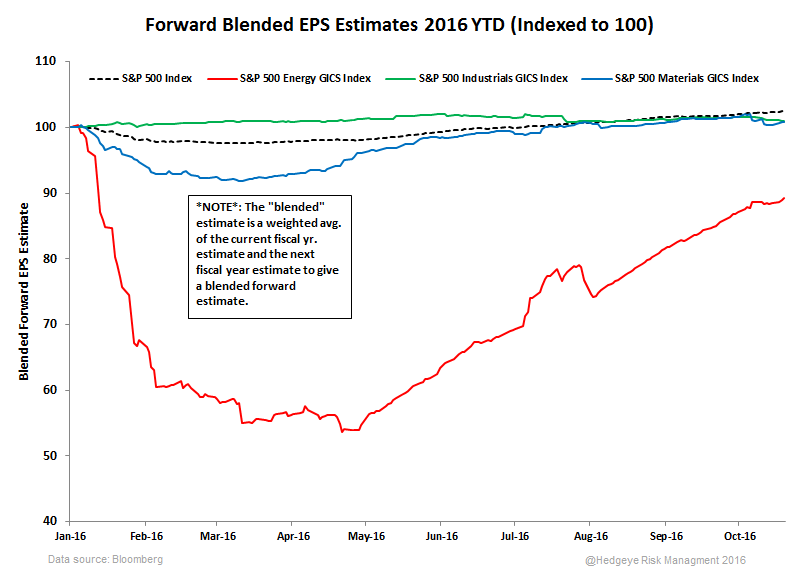
Of note here is that much of the positive revision has come directly from resource sectors with fixed cost leverage to higher commodity prices. Below we show revision trends in the resource space indexed to 100 for 2016. Energy has nearly made up the ground it lost in Q1 2016 at $33/barrel. There is no downside scenario in resource sector estimates as the net futures and options positioning in crude oil reached a level not seen since pre-USD breakout in 2014 (+2.23x extended on a TTM z-score basis).
The energy sector likely pulled S&P earnings negative for the 1st and maybe even the 2nd of the 5 quarters of negative comps, and a continuation in current trends will bring a comping of those comps in the energy sector into 2017. What does that say about other sectors? 6 of 11 (including real estate as a recent addition) are up against positive comps with 4 of those 11 up against double digit comps in Q3 of 2015. The expectation of any kind of transitory flow-through from higher energy prices looks non-existent (again assuming the trend continues as consensus is betting). It’s possible “transitory” was only a story on the way down.
- Looking at growth expectations, even if the average intra-quarter revision trend is considered with estimates, earnings growth still steps up meaningfully from here in every sector. Estimates are up on a rope since starting Q2 and we will continue to hash out commodity reflation’s contribution to the estimates vs. the economy’s capacity to grow broadly into lofty expectations as reporting season plays-out - Our Q4 themes deck questions the latter.
Significant earnings growth over the next several quarters is already an assumption embedded in the market’s current cycle peak multiple. More specifically, earnings growth expectations are +7.2%, +14.3%, +11.5%, and +13.0% for Q4 16 – Q3 17. Again it’s not just energy. Many sectors tied to consumption have double digit comps embedded in expectations.
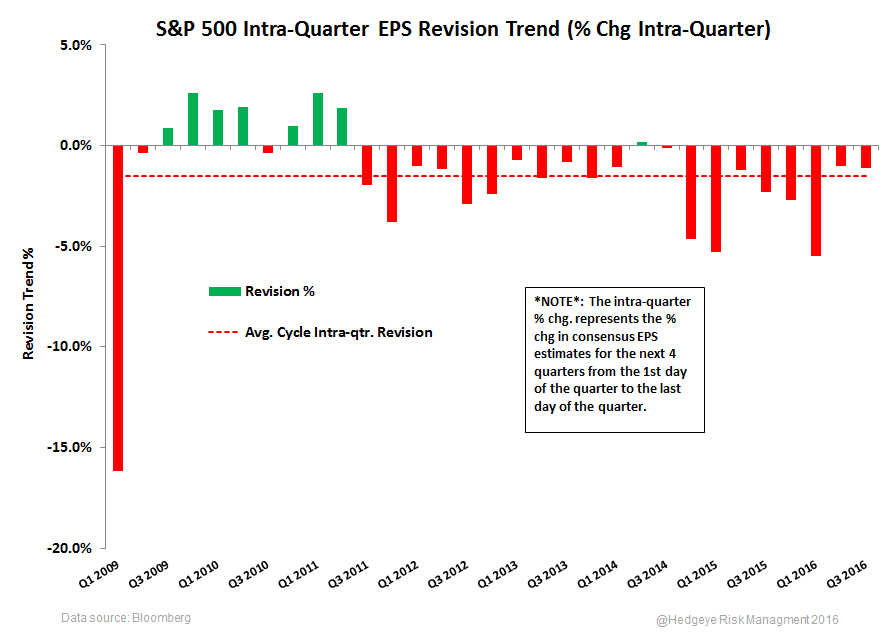
The typical chronology has been a revision of lofty expectations intra-quarter with companies beating estimates (the guide down and beat). So taking trends for this cycle, forward 4-qtr EPS estimates have gotten revised intra-quarter by 1.5% on average (last day of quarter EPS estimate is 1.5% lower than it was at the beginning of the quarter). And, companies have beat estimates this cycle by over 4% on average - see below for a sector breakout.
After adjusting for the typical guide down and beat into earnings, growth expectations still look optimistic in our view given current macro headwinds, especially related to sectors who benefitted from lower commodity prices.


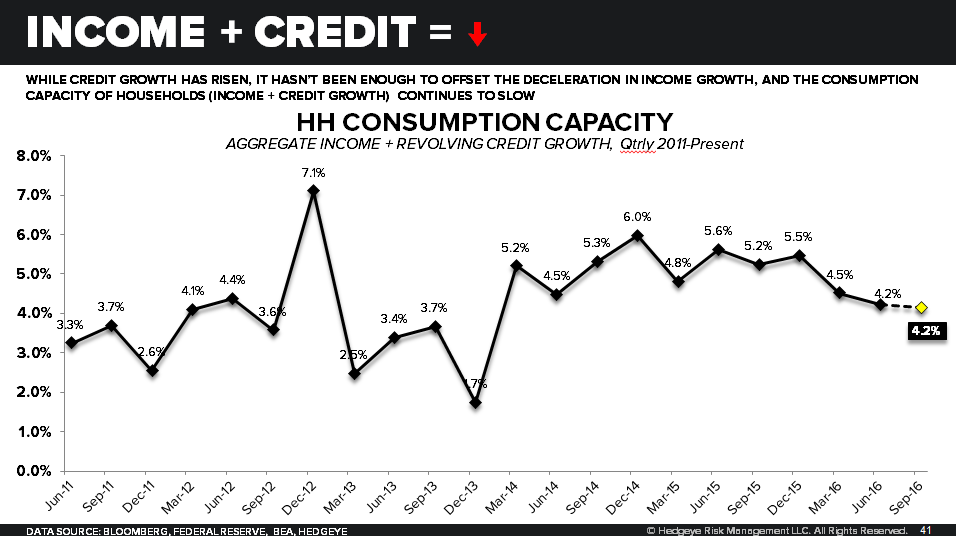
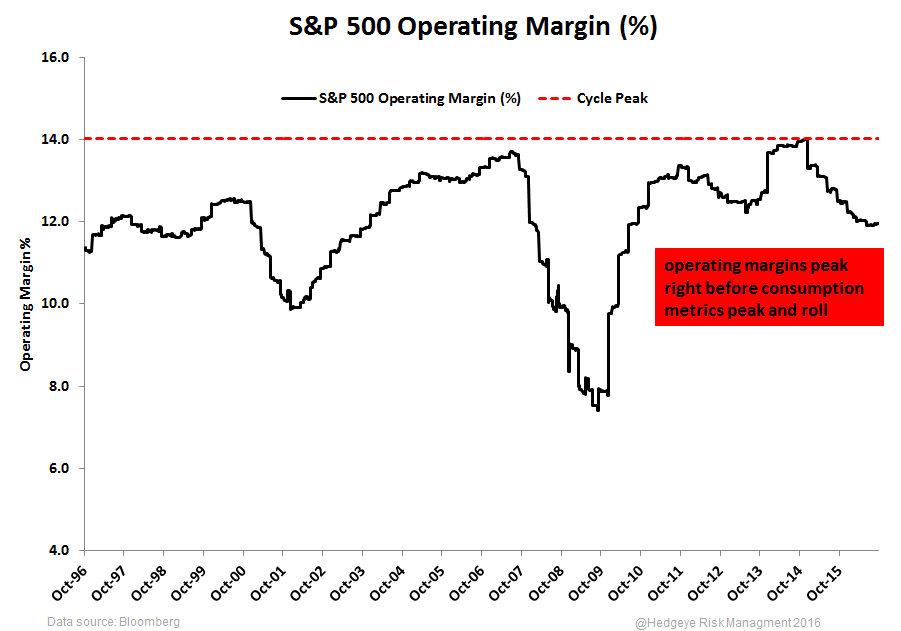
All-in-all we analyze the sine curves (they’re less manic), and when comparing the continuation in negative second derivative trends in employment and consumption growth (which peaked in 1H 2015 right after corporate margins) to lofty corporate profit expectations with revision trends considered, we question another extended period of corporate margin expansion from here across sectors even if easy comps are ahead in energy (again that’s if current trends continue). Consumer credit trends have been a cushion to the slowdown in employment and consumption growth, but credit's positive contribution is also showing early signs of slowing - see the three charts below from our "#Labor's Lag" theme that outline ongoing headwinds to consumption and corporate profits. Let us know if you need a copy of the themes deck.
Please feel free to shoot any feedback our way – We’ll have another update out as earnings season progresses.