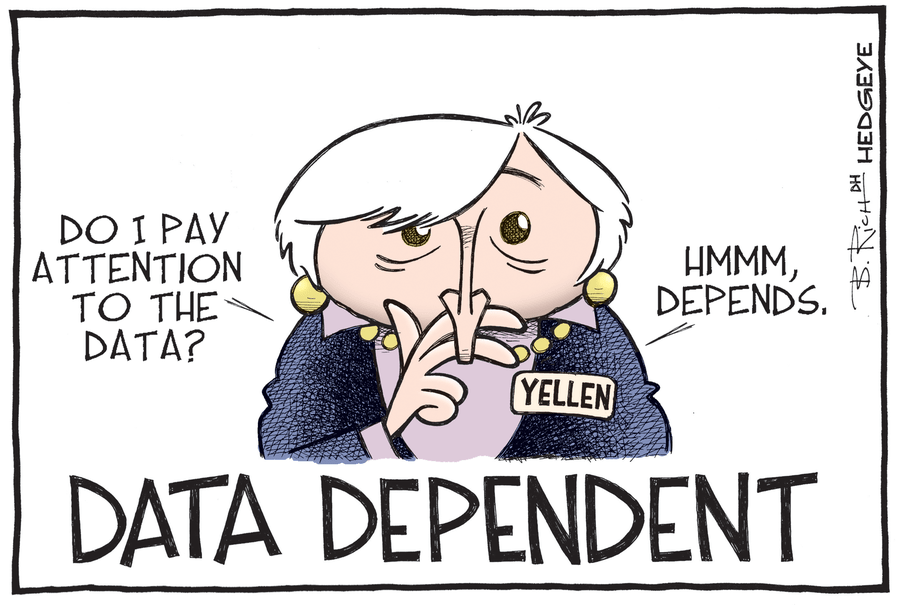
There are innumerable examples of economic indicators rolling over that support our U.S. #GrowthSlowing call. So what's Fed head Janet Yellen talking about when she said the following last week:
“The Committee judges that the case for an increase in the federal funds rate has strengthened but decided, for the time being, to wait for further evidence of continued progress toward its objectives.”
"STRENGTHENED"?
The Fed's own 2016 GDP forecast was just revised down to +1.7%-1.9% from 1.9%-2.0% prior. Clearly, the Fed is trying to push a narrative about the U.S. economy that simply isn't true.
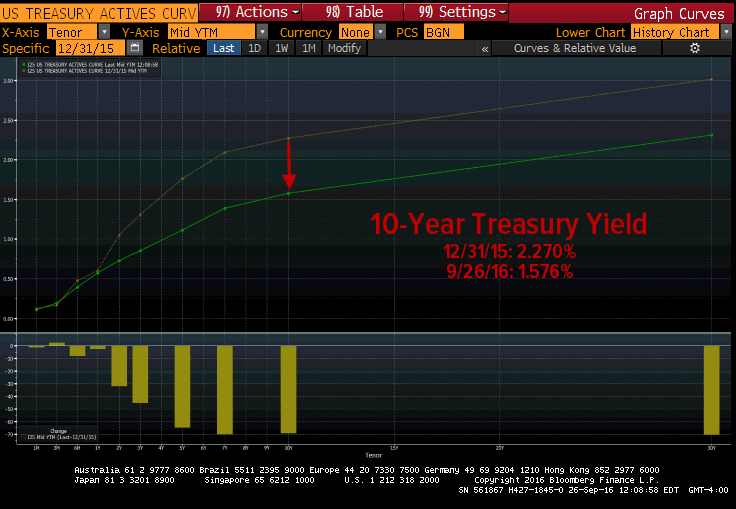
So, after balking yet again on rate hikes, the 10s/2s Treasury yield spread compressed to 85 bps today. That's a crystal clear macro market signal confirming our call that U.S. growth continues to slow.

As you can see in the chart below...
The Treasury yield curve continues to flatten in spite of all the talk of Fed rate hikes and Wall Street's perennial fear that the bond market rally is finally dead.
Make no mistake...
The U.S. economy continues to slow. The Fed can continue to pretend otherwise but reality always prevails.