Editor's Note: Below is a new Hedgeye Guest Contributor research note written by Dr. Daniel Thornton. During his 33-year career at the St. Louis Fed, Thornton served as vice president and economic advisor. He currently runs D.L. Thornton Economics, an economic research consultancy. This piece does not necessarily reflect the opinion of Hedgeye.

In my recent essay on Chair Yellen’s Jackson Hole speech (here), I questioned Yellen’s assertion that the Federal Open Market Committee’s (FOMC’s) QE and forward guidance policies had reduced long-term yields. I presented Figure 1 showing that the 10-year sovereign yields for the U.S., the U.K., Germany, and Australia have trended down similarly since September 2008. I suggested, facetiously, that if QE and forward guidance had reduced the 10-year Treasury yield, they lowered yields in the other three countries even more.
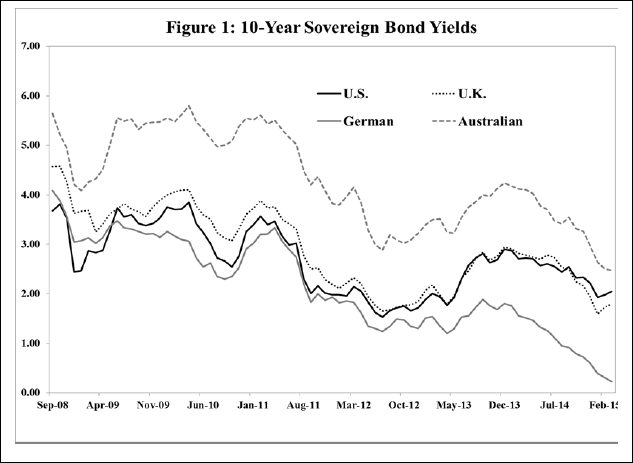
I then noted that Yellen went on to suggest that long-term yields declined globally over the past decade because the “long-run neutral real rate” had fallen due to slower growth in the working-age populations, smaller gains in productivity, decreases in the propensity to spend in the wake of financial crises around the world since the late 1990s, and the lack of attractive capital projects worldwide. I asked how Yellen was able to distinguish the effects of QE and forward guidance on the 10-year Treasury yield from the effect of the decline in the “long-run neutral real rate,” suggesting that she couldn’t. I concluded by saying, based on economic and finance theory and my empirical research on the effectiveness of QE and forward guidance, the answer is close to 0% for the former and close to 100% for the latter.
John Taylor wrote me saying that while he “agreed with my analysis of QE,” he wondered if the apparent low long-term rates “might be due to expected low policy rates and even negative policy rates abroad.” I am writing this clarification to say that I agree with John. Indeed, I am sure that the FOMC’s low interest rate policy and similar policies of other central banks have caused long-term yields to be lower than they otherwise would have been. This essay explains why AND why I am so sure. I also reiterate why I am fairly certain that the FOMC’s QE and forward guidance policies have had little or no independent effect on long-term yields.
I am sure that the low interest rate policy has affected longer-term rates because my previous, but yet unpublished, research (Conundrum) shows that the FOMC’s interest rate policy affected Treasury rates along the term structure. This happened when the FOMC began using the funds rate as a policy instrument in the late 1980s. That paper shows that this also happened in the U.K. and New Zealand when the Bank of England and the Reserve Bank of New Zealand began using a short-term interest rate as their policy instrument. Consequently, I am reasonably confident that the low and negative interest rate policies abroad have reduced longer-term rates.
My “Conundrum” paper is long and detailed, so I will only present the crux of the evidence here. That paper was motivated by former Fed Chairman Alan Greenspan’s observation in February 2005 that the 10-year Treasury yield hadn’t moved despite the fact that the FOMC had increased the funds rate by 150 basis points. He considered a number of possible explanations for what he considered the aberrant behavior of the 10-year Treasury yield. Rejecting all of them, he concluded it was a “conundrum.”
Unlike most researchers, I didn’t assume the conundrum began when Greenspan first noticed it. I did something that the Board of Governor’s Staff and Bill Poole (who was President of the Federal Reserve Bank of St. Louis at the time) did to estimate the effect of a change in the funds rate on the 10-year Treasury yield. Specifically, I ran a regression of the change in the 10-year yield on the change in the funds rate over the sample period from March 1983 to June 2007. But rather than estimating the regression over the entire sample period as Poole and others had done, I used a rolling sample of monthly observations.
Figure 2 shows the estimates of 2 R (for readers unfamiliar with regression analysis, think “correlation”) using a 48-month rolling sample (each point on the line shows the estimate of 2 R, correlation, based on 48 months of data ending on the dates shown in the figure). The figure shows that the relatively strong correlation between changes in the funds rate and changes in the 10-year yield early in the sample declined to essentially zero in the mid-1990s and remained there.
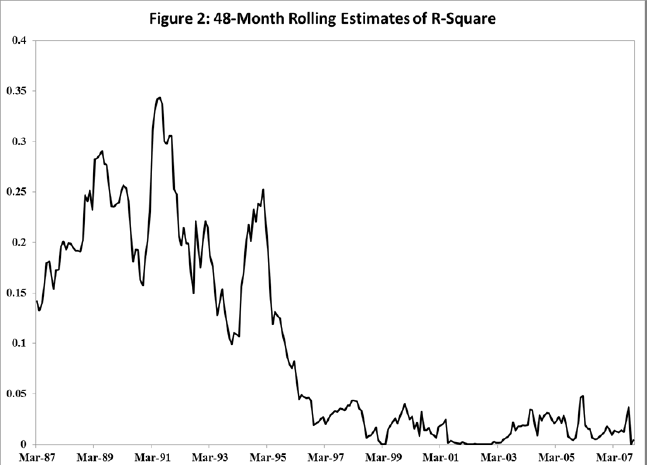
I concluded that the relationship between the funds rate and the 10- year yield changed long before Greenspan noticed it. But when did the change occur? To answer this question, I used a statistical test designed to find the most likely date of a change if, indeed, a change had occurred. The test revealed that a highly statistically significant change in the relationship occurred in the late 1980s, with the most likely date being May 1988.
I had a hunch about why the change went unnoticed for so long. The change went unnoticed because both rates trended down over the entire sample period. Figure 3 shows the 10-year Treasury yield and the federal funds rate over the period March 1983 to June 2007 along with quadratic trends that are common to both rates (the trend lines differ by the average term premium of 1.47 percent).

The common negative trend gives the impression that the rates are moving closely together when, in fact, the only part of the rates that is moving together is their common negative trend. When the common trend is removed, they are uncorrelated after the late 1980s. This is shown in Figure 4, which shows both rates with the trend removed. The vertical line denotes May 1988. The figure shows that the detrended rates move closely together until the late 1980s, but independently thereafter; there are periods when they appear to move somewhat together, periods when they move in opposite directions, and periods when one rate moves but the other does not. Hence, Greenspan’s conundrum occurred in the late 1980s, circa May 1988.

It went unnoticed because both rates trended down over the period. Greenspan noticed it in early 2005 because by then the downward trends had begun to flatten out and were no longer a dominant feature of the data. Based on some previous research (Transcripts), I had a good idea why the relationship changed. And it wasn’t because of a change in the behavior of the 10-year yield as Greenspan and others assumed. It occurred because the FOMC began using the funds rate as its policy instrument. With the funds rate as the policy instrument, the funds rate changed only when the FOMC changed its target for the funds rate—it changed when the FOMC changed policy and not when market rates moved as it had previously.
In contrast, the 10-year Treasury yield (which Greenspan and most economists acknowledged is determined by economic fundamentals and not greatly affected by the funds rate) continued to respond to economic and financial market information as it always had. Based on transcripts of FOMC meetings, the paper shows that the FOMC began using the funds rate as a policy instrument in the late 1980s. Indeed, transcripts also suggest that the most likely date of the change is May 1988.
Greenspan announced that he was increasing the funds rate target from 6.75 percent to 7.0 percent on May 9, 1988, following a May 6 conference call. At the May 17, 1988, FOMC meeting, Greenspan said that he took the action because of concern that inflation may be accelerating. In contrast, when questioned at the February 10, 1988, FOMC meeting why he reduced the funds rate target from 6.82 percent to 6.62 percent on January 27, 1988, Greenspan said, “the markets were coming down on their own at that particular time—clearly trying to seek a somewhat lower market rate level.” Hence, the January change occurred simply to bring the funds rate into better alinement with other rates—not to achieve a policy objective.
The May 1988 date is also supported by the FACT that in a Federal Reserve Bank of St. Louis Review article co-authored with Bill Poole and Bob Rasche and published in 2002, (Poole, p. 73), we found that May 9, 1988, was the first time in the 1980s that the market knew a policy action occurred. The FOMC’s use of the funds rate as a policy instrument affected the relationship between the funds rate and other Treasury rates (see the Conundrum paper for details).
But more important for the question at hand, it also affected the relationship between the 10-year Treasury yield and other Treasury rates. The best way to see this is to see how it affected the relationship between the de-trended 10-year yield and other de-trended Treasury rates (all rates have been de-trended with the identical common trend). These effects are shown in Figure 5 which shows 48-month rolling estimates of 2 R between the de-trended 10-year Treasury yield and the de-trended 5-year, 1-year, 6-month, and 3-month Treasury rates. The vertical line denotes May 1988. The correlations were high and stable until the late 1980s. The figure looks much the same when a 24-month rolling sample is used. After the late 1980s, the correlations were much lower and less stable.
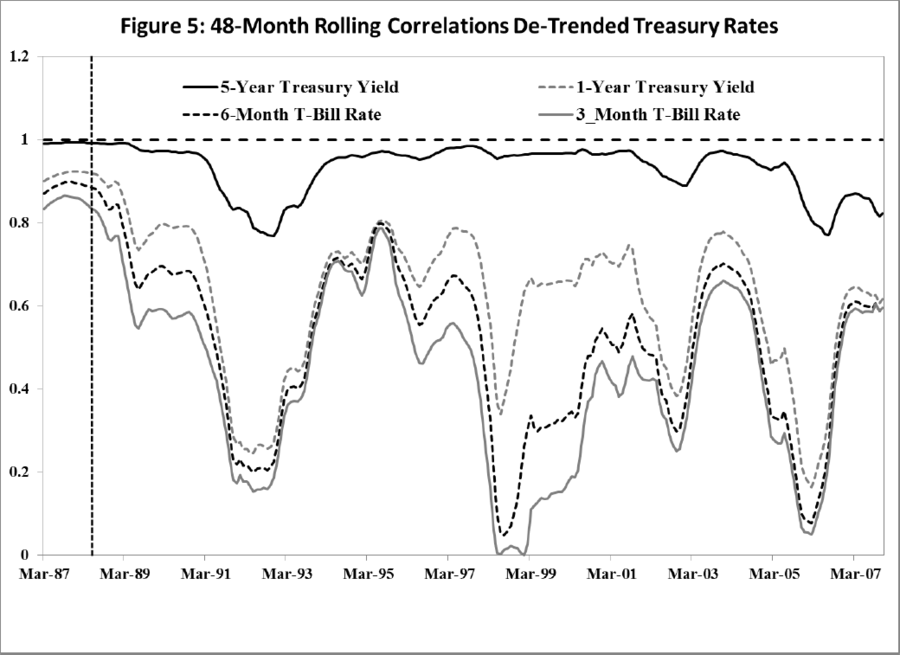
Hence, the FOMC’s use of the funds rate affected the correlation between the 10-year yield and shorter-term Treasury rates, with the effect being weaker the longer the term to maturity. Unfortunately, this analysis provides no information about whether the low interest rate policy affected the 10-year yield because the analysis of the effects on shorter-term rates is relative to the 10-year yield. In an attempt to get some insight into whether the FOMC’s decision to use the funds rate as a policy instrument affected yields with maturities of 10 years, I repeated the analysis of Figure 5 on the correlation between the de-trended 20-year and 10-year Treasury yields.
The result was very similar to the correlation between the 10- and 5-year yields shown in Figure 5, with even a larger effect toward the end of the sample. The effect on the 10-year yield is shown in Figure 6, which shows the spread between the 20- and 10-year yields (20/10) and the federal funds rate over the period July 1954 to August 2016 [Note: the 20-year yield is not available from March 2002 through January 2006; during this period the 30-year yield was used]. The vertical line denotes May 1988.
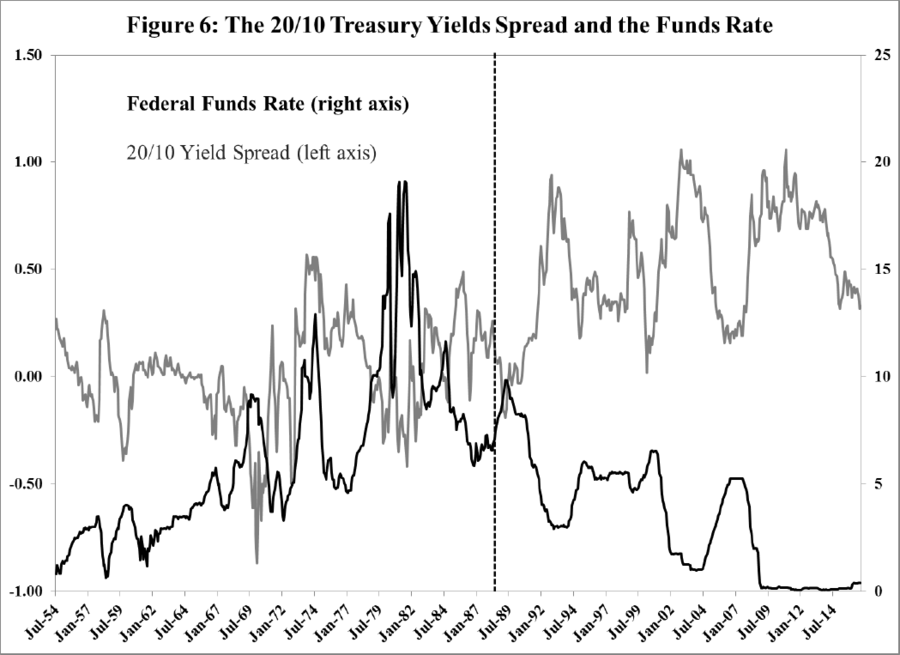
The effect of the FOMC’s decision to use of the federal funds rate as a policy instrument is reflected in the marked change in the behavior of the funds rate in the late 1980s. The funds rate becomes much less variable and is marked by numerous “flat” periods that correspond exactly to periods when the FOMC left its funds rate target unchanged. There are a couple of “flat” periods in the funds rate prior to the mid-to-late 1960s, but these were due to the FACT that I noted in my first Yellen essay (here); specifically, that until the mid-1960s the funds rate was capped by the Federal Reserve’s discount rate. The average spread was much wider after May 1988, 52 basis points after, compared with 2 basis points before.
Moreover, the correlation between the spread and the funds rate increased dramatically, from -0.09 before, to -0.80 after. This could be misleading because the funds rate was capped by the discount rate until the mid-1960s. Consequently, the low correlation during the first period could be due, in part, to this FACT. Indeed, the correlation is somewhat higher, -0.25 over the period from January 1970 to May 1988, but not high enough to alter the conclusion.
That the behavior of the spread changed after the FOMC started using the funds rate as its policy instrument strongly supports Taylor’s, and my, belief that the FOMC’s low interest rate policy has distorted sovereign debt yields with maturities of at least 10-years. Hence, the policy has also distorted yields on long-term private securities. It seems likely that the low and, in some instances, negative interest rate policies of other central banks have had a similar effect.
Ok, so what does all of this mean?
First and, perhaps foremost, it means that any policy that causes yields to be different than they otherwise would have been causes the allocation of economic resources to be different too. This is fine if central banks know more than the market does about what yields ought to be and how resources should be allocated. But many economists, I among them, believe that this is extremely unlikely; even more unlikely because the FOMC’s policy has been distorting yields for nearly eight years.
Of course, that is the intent. Central bankers have been keeping interest rates low in the arcane and hopelessly misguided belief that low interest rates are a major determinant of investment and consumer spending, and that temporary increases in spending will somehow stimulate economic growth. Ben Bernanke and other central bankers must have forgotten what they once knew and wrote about (Bernanke); namely, that interest rates are not a very important determinant of spending.
Implication: Keeping interest rates low is unlikely to have a significant effect on spending. Moreover, the belief that such increases in spending can have a permanent effect on economic growth is misguided (Economic Growth Part 1 and Failed).
Because this analysis deals only with the FOMC’s interest rate policy, it provides no information about whether QE or forward guidance reduced longer-term interest rates. But it does speak to the issue I raised in the previous Yellen essay; namely, the analysis points to the difficulty of determining whether QE and forward guidance had any independent effect on long-term yields. Some economists and policymakers suggest that the FACT that long-term yields responded immediately to some of the QE or forward guidance announcements is evidence that these policies were effective. But the FACT is that such “announcement effects” have essentially no evidentiary value. To be effective, QE and forward guidance must have had a persistent effect on yields.
Announcement effects provide absolutely no information about the persistence of the effect. My conclusion in the previous essay stands: Yellen has no idea how much, if any, of the decline in Treasury yields was due to QE and/or forward guidance. My conclusion that these policies had essentially no effect on longer-term yields, independent of the effect of the FOMC’s zero interest rate policy, is based on the FACTS that:
- Their effectiveness finds little support in economic or financial theory (see Requiem); and
- Empirical evidence that these policies have been successful is weak, questionable, and/or erroneous (see Requiem, QE’s Effectiveness, and Announcement Effects).
My overall conclusions are: Central banks’ low interest rate policies have distorted long-term yields and the allocation of economic resources by making long-term yields lower than they would have been otherwise. Central banks’ QE, forward guidance, and other such policy actions have had essentially no independent effect on long-term yields.
