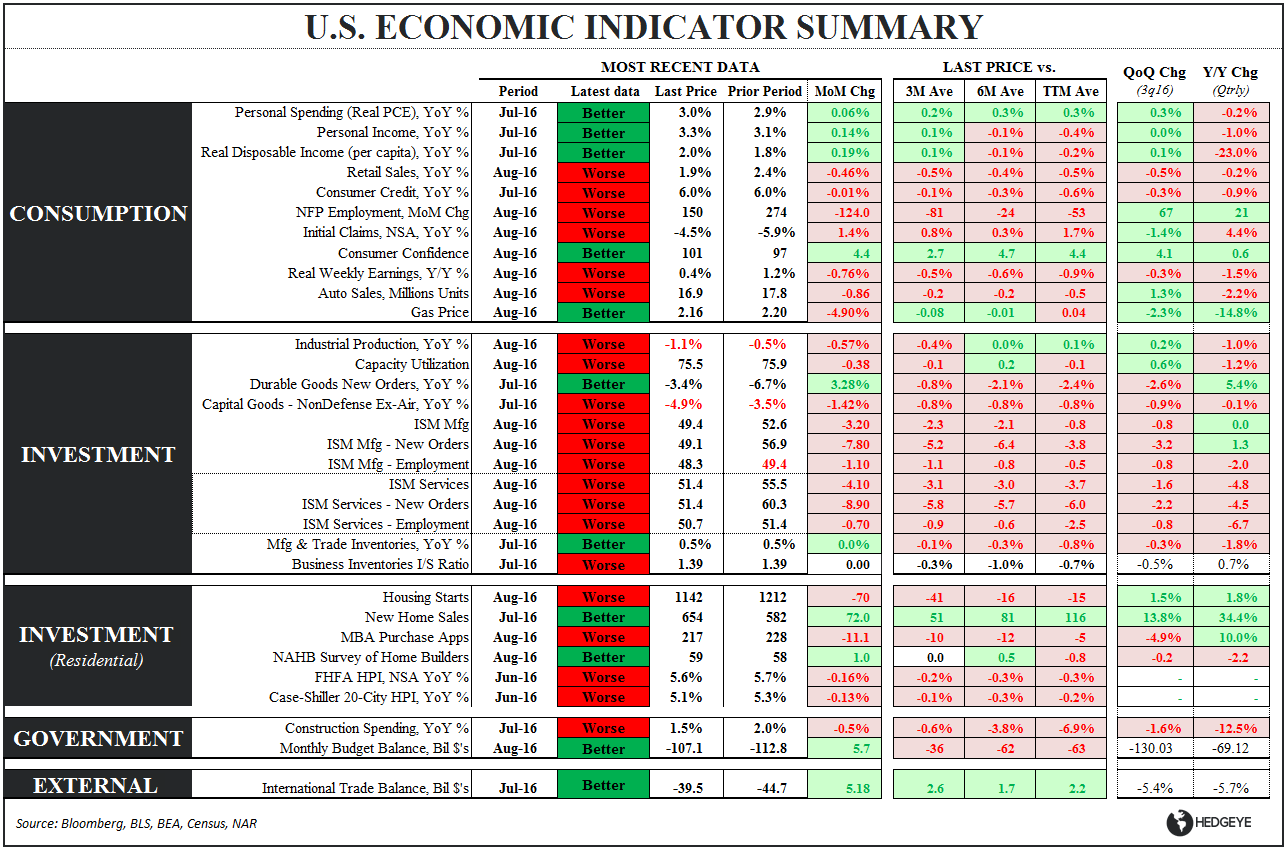
CHART OF THE DAY: Why Did The Fed Go Dovish? (21 of 32 Economic Indicators Getting Worse)
09/22/16 08:34AM EDT
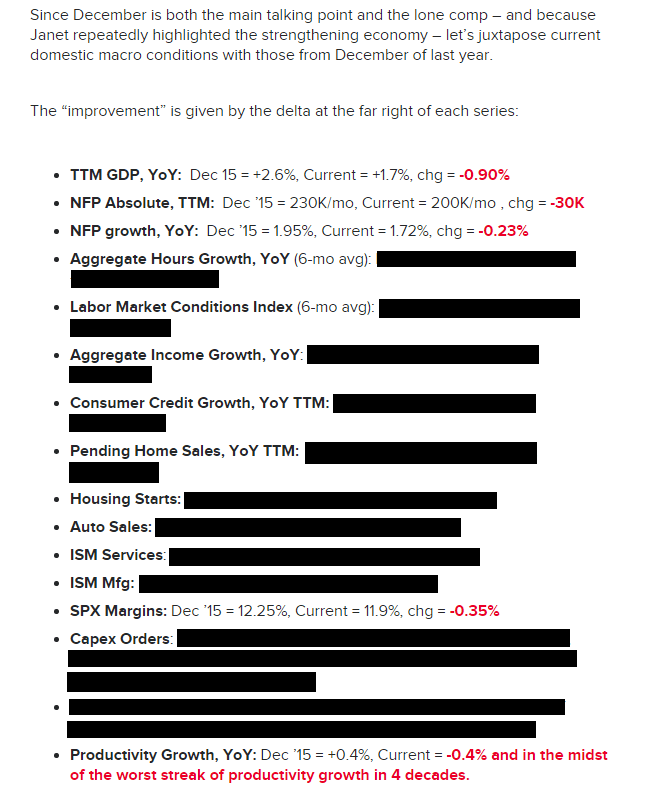
Editor's Note: Below is a brief excerpt and chart from today's Early Look written by Hedgeye U.S. Macro analyst Christian Drake. Click here to learn more.


© 2024 Hedgeye Risk Management, LLC. The information contained herein is the property of Hedgeye, which reserves all rights thereto. Redistribution of any part of this information is prohibited without the express written consent of Hedgeye. Hedgeye is not responsible for any errors in or omissions to this information, or for any consequences that may result from the use of this information.