We’re putting BBBY on the short side of our ledger. This is not a high conviction short in absolute terms, as the name is trading at ≈10x a realistic earnings number for next year, a 5-6x EBITDA multiple, and at an 8% FCF yield – even on our beared-up numbers. Given that the stock is already off 46% relative to the market since last year’s peak, the short interest remains near an all-time high (10%), and this has traditionally (ex the past 3-years) proven to be one of the best management teams in retail, we initially looked into this with a long bias.
But after digging deeper into the numbers, BBBY’s investments, and synching with the competitive pressures in the market, we’re not so sure earnings deserve to ever grow again. This is a fairly prevalent theme for us right now (Target is our top short and is predicated on its lack of investment and likelihood of a series of prolonged misses). Case in point, our analysis shows that BBBY faces 32% customer overlap with Wayfair – a company that explicitely states that it is going after BBBY’s jugular. This ratio is up 1,000 basis points over only the past 16 months. If that last sentence did not shock you, it should – it certainly shocked us. We have NEVER seen a company be marginalized that quickly by an online competitor. Not Dick’s, not Kohl’s, and not Foot Locker. The bad news here is that it is still quite low at 32% Wayfair overlap. There is no reason it can’t continue to get clipped all the way up to 50-60%. It is, without question, moving briskly into BBBY’s turf, and likely at a rate faster than expected. And that’s on home furnishings – nevermind the hardgoods you can easily get on Amazon. For the record, with the exception of brands like Ralph Lauren bedding and Henckel knives we’re hard pressed to find brands that sell at BBBY that you can’t also find at either Wayfair or Amazon (or both). Wayfair now even has a full color palatte of Le Cruset cookware, and items like the Nutri-Ninja have been commoditized with 100% price transparency. Remember that 90% of what BBBY sells does not have to be tried on for size. It’s the most susceptible of any type of good to shift to online competition.
This Chart Is Scary If You Own BBBY

One thing that is telling for us is that when we measured distribution center throughput for BBBY versus retailers that share similar characterustics, we see that it has near peak productivity – speaking to how good it is. But on the flip side, it is sitting at extremely low e-commerce penetration of 5% (see analysis below). That tells us that BBBY is likely underinvested in DCs and other infrastructure to accelerate its competitive positing vis/vis Wayfair, Amazon, an increasingly desperate Target/Kohl’s and an increasingly competitive (for now) JC Penney.
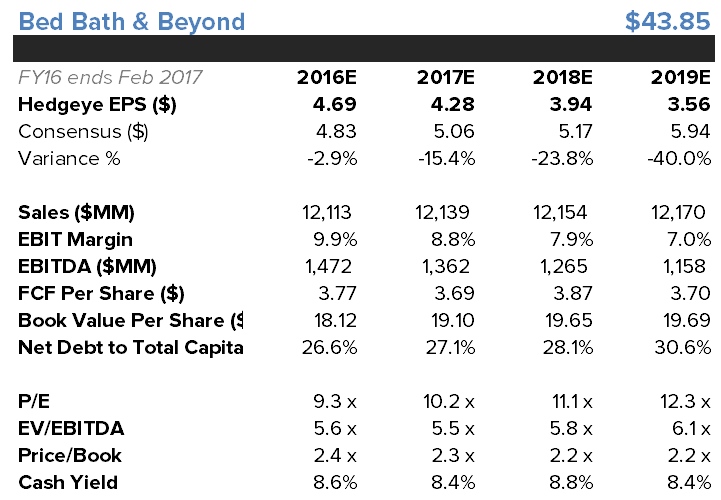
Though these fat-tailed trends take time, we’d point out that the past 2-years of competitive pressure show just how things can accelerate faster than expectations. We’d also point out that we’re putting our money where our mouth is with our earnings estimates. We’re at $4.28 next year versus the Street at $5.06, and have estimates 40% below consensus by 2019. Given that BBBY has a fairly high quality management team, we think that it likely recognizes that it has underinvested – or as soon as it does it will pull all the right levers, no matter how painful (unlike TGT which will likely miss until management has to be swapped out).
We totally get it that this stock has been left for dead. That’s why we’d much rather revisit it as a stand-alone short after a pop on low expectations – likely next Wednesday’s print. But the reality is that so many funds have to own some of it, as it is in the benchmark (S&P 500). For those people, we’d definitely own a lot less of it into any form of strength from its current mid-$40s level.
The biggest area we could be wrong is on the non-Bed, Bath & Beyond stores. Could Cost Plus (250 of ≈1,500 stores) finally turn out to be a growth or margin engine after 3-years of struggling? Doubtful, but it’s possible. Is there underlying monetizable value in Christmas Tree Shops or Harmon Cosmetics? Doubtful. But these other business increasingly deserve more attention. We don’t want to get caught focusing on the broken piece of the business from which an otherwise good management team is acquiring away. More to come on that.
But in the end, our near-term positioning is that if you own it, there might not be a rush to sell it. But we also think there is close to zero reason to own this name over the next three years. Sometimes things are cheap for a reason.
More detailed analysis below.
Here’s More Detailed Analysis:
Investment Buckets – This is billed as the peak investment year from a capex perspective as the company wraps up its second fulfillment facility in two years and rolls out its new POS system to stores. But, we think the need to invest in e-comm to make itself competitive (it’s only 5% of sales) as well as the need to add additional distribution capacity will weigh on margins and ultimately FCF. Here’s where the company is focused and our two cents.
IT Infrastructure – 4x the budget from 5yrs ago, 500 person team.
- Hedgeye’s take: Ultimately headed higher.
Merchandising – exclusive online merch, health/beauty, food & beverage, exclusive brands, mattresses, jewelry, and furniture. Last 3 direct from the vendors.
- Hedgeye’s take: We don’t think BBBY works as a platform. Amazon already does it better than anyone else who has tried. Plus well behind the curve on vendor direct to Wayfair. Ultimately the company will win with the consumer with selection, not breadth.
Pricing – Dynamic pricing
- Hedgeye’s take: Online obfuscated any pricing power. 20% coupon or need for product now only way for BBBY to win pricing war. Headed towards free shipping which will be a killer.
Fulfillment – 2 new facilities opened in past 2 years.
- Hedgeye’s take: We give BBBY credit for investing behind an underfunded distribution network, but the company needs more capacity or to outsource if it wants to play the fulfillment game.
Category Looks Broken
The bellwethers in this category – BBBY, WSM, RH, PIR – look particularly broken. With average comps for the group decelerating from the mid-DD range in 2012 to MSD through 2014 and 1H15, down to negative territory in the quarter the companies will/have reported. The government data doesn’t quite synch with the trends we’ve seen reported by the public entities, though numbers have decelerated to 3.5% in 2Q16 (May-July) from a MSD run rate 1yr ago. One explanation, and we think it will be no surprise to anyone, is the considerable share being taken by Wayfair, adding an incremental $1.7bn over the past 2yrs.
Now it may sound a bit silly to call out a company who has 1% share of a highly fragmented $320bn market. But, hear us out. We think that W is causing considerable disruption to the space for two reasons…1) product deflation as the company has no margin to protect and 2) increasing the consumer’s willingness to buy the product online. To be clear on the last point, we are not talking about furniture as we think (and our research confirms) there is a very big need for product interaction in a physical store. What we mean is that the soft-goods part of the equation is very much up for grabs as consumers push more of their purchases in this category online.

Wayfair Taking More & More Traffic
So what does it mean for BBBY specifically? The numbers here are clean as day. They look at the consumer overlap online for Wayfair vs. Bed Bath & Beyond. With the trend line going straight up and to the right from 20% in early 2015 to 30% where we currently sit. We expect that number to continue to tick hire as W doubles down on the soft-good side of the business as it recognizes that the online only furniture model has many more limitations than a $90bn management suggested TAM would otherwise suggest.

Categories Best Suited For Online – BBBY Sells Em, But Not Online
BBBY’s product offering is the most susceptible to online competition in the home furnishings category. Based on our survey work, it’s clear that the consumer is 2x more likely to purchase décor, linens, tableware, and kitchen online compared with furniture. And while the company works to diversify its online only offering to include jewelry and furniture – it’s the core product that should be a slam dunk for the company to win online. Yea, Christmas Tree Shops will probably never cater to an online demographic, but that doesn’t explain BBBY’s dot.com penetration at a measly 5% of sales. What that tells us is, the company needs to spend – A LOT – in order to compete with the likes of AMZN, Wayfair, WMT, you name it.

Not Set Up To Win Online
BBBY used to be extremely efficient in the way it flowed product from its vendor base directly to stores – limiting overhead in the form of distribution centers. That unfortunately doesn’t translate to online commerce – where the key to competing outside of price is speed to customer. Prior to the Linen Holdings/Cost Plus acquisition in 2012, BBBY operated a total of 16 distribution/warehouse centers for an aggregate of 3.1mm sq. ft. After the acquisition the square footage jumped to 5.8mm sq. ft. and has held relatively steady coming in at 6.1mm sq. ft. at the end of this past year. The company has added two new additional distribution facilities over the past 2 years – one in Vegas the other in TX to help augment the 175 stores set-up as regional fulfillment facilities, but we think there is still a lot more that needs to be added. Meaning the peak capex year promised in 2016 probably isn’t a reality.
We pulled down the total distribution square footage for a handful of retailers in BBBY’s competitive set to gauge the efficiency of the company’s distribution network. The metric (which is represented by the blue bars below) is calculated by taking total sales/distribution square footage. We then paired that up with each companies e-commerce as a % of sales. The trend here is pretty clear…lower distribution productivity = higher e-comm penetration. Intuitively that makes sense as the company’s with a higher e-commerce mix invested ahead of the consumer transition to DTC. BBBY is pretty far behind the curve.

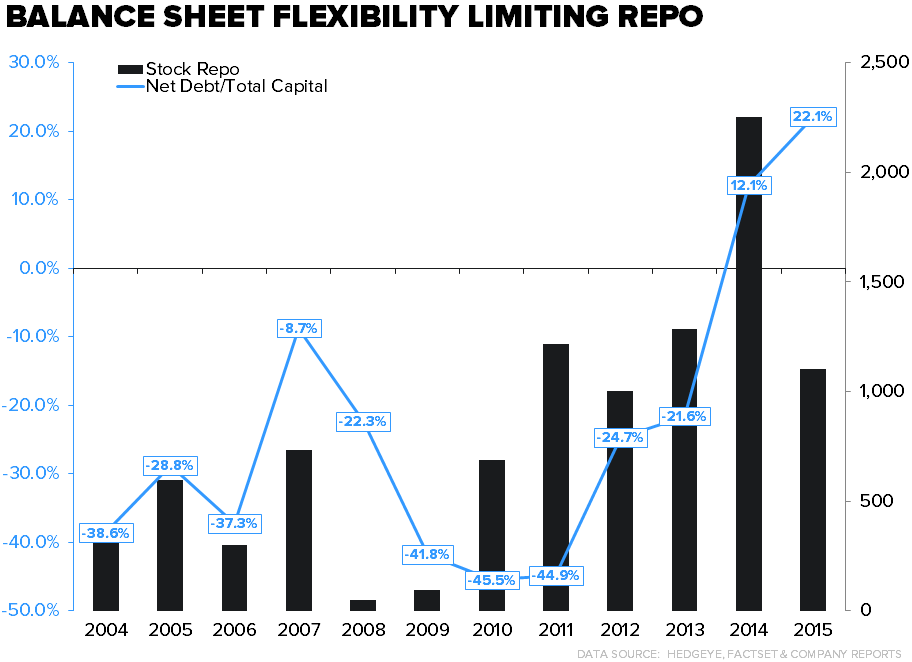
Financial Engineering Drying Up
That’s a big deal for a company like BBBY who hasn’t grown net income since 2012. The company fired the last bullet in its chamber when it announced its dividend earlier this year, and without a material change in the operating environment we think FCF in the range of $400-$500mm is the new norm. A dividend is probably a good idea for a company like BBBY, as it offers up significant valuation support on otherwise decent cash flow. But this also hampers BBBY’s ability to buy back stock. And, let’s not forget that this is now a company with leverage, which it built throughout the economy recovery when other retailers were increasingly delevering financially.