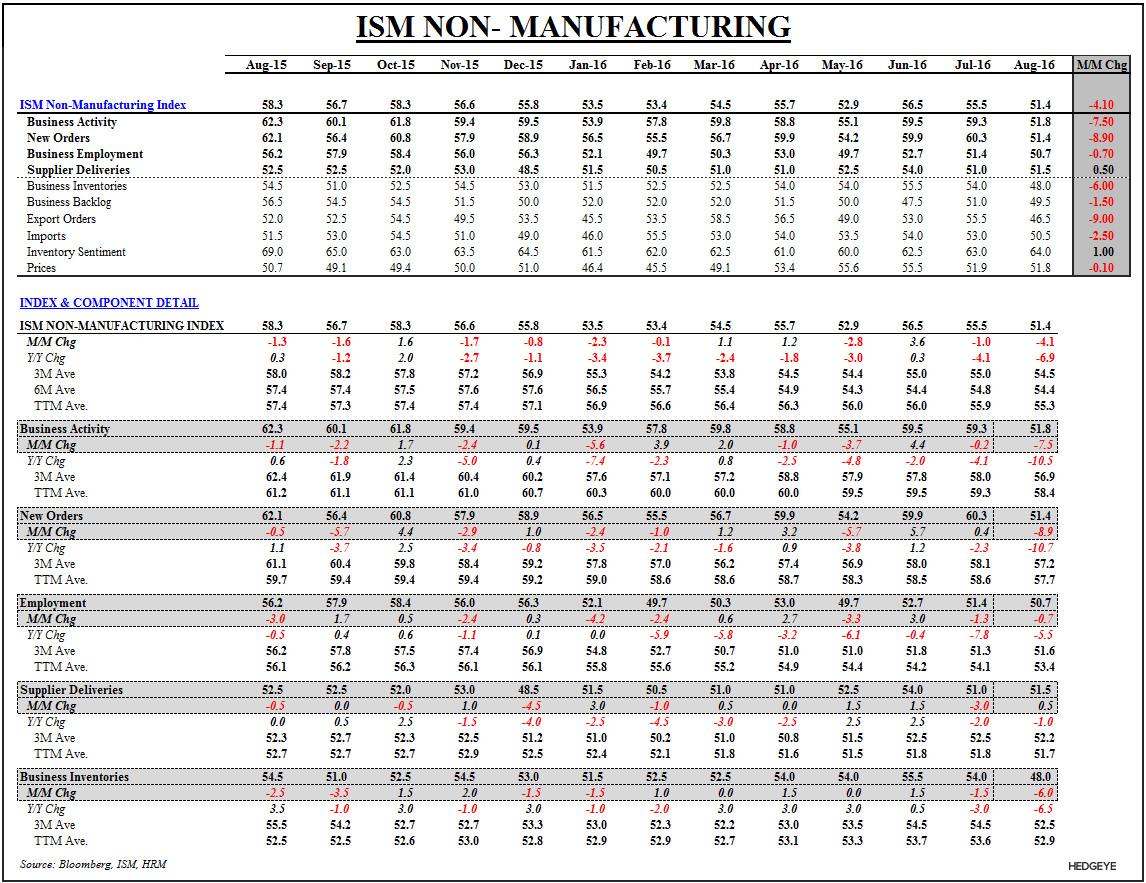
ISM Services printed its worst reading since 2010 in August. The Headline dropped -4 pts sequentially with Business Activity and New Orders dropping a remarkable -7.5 pts and -8.9 pts, respectively. Employment dropped -0.7 pts as well and continues to barely hold above the expansion-contraction Mendoza line at 50.7.
Across the leading subindex, New Orders posted its largest sequential decline in 104 months, fully reversing from prospective overheating to flirting with contraction.
In short, if you broadly divide the economy into Services (~88% of GDP) & Goods (~12%) and do the data dependence math for August:
- GOODS = Contraction
- SERVICES = worst print since 2010
If you’re more into data point breadth, here's the sequential scoring just a week into August data reporting - a list that “data dependent” hawks should obfuscate or ignore.
Chicago PMI = Worse
ISM Services = Worse
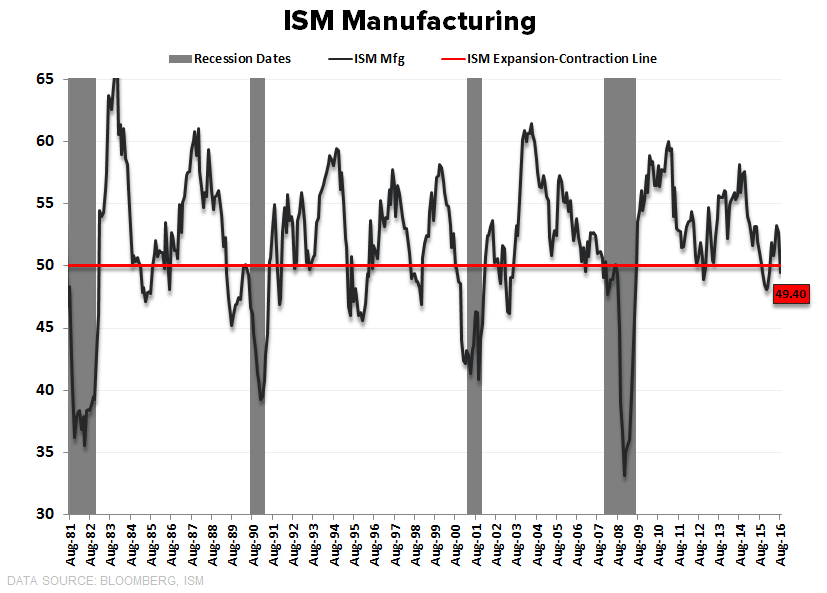
ISM manufacturing = Worse
Markit Manufacturing PMI = Worse
Bloomberg Consumer Confidence = Worse
NFP = Worse
Auto Sales = Worse
Labor Market Conditions Incex = Worse
USA GDP? We’re now tracking at +1.1% YoY/+1.7% QoQ SAAR for 3Q16, which is down from the previous update of +1.2% YoY/+1.9% QoQ SAAR. For Q4 we’re +1.0% YoY/+0.4% QoQ SAAR.