“You typically find a different distribution than a bell curve.”
-Benoit Mandelbrot
Since I got back from vaca, the questions I’ve been getting on The Macro Show (now daily at 9AM EST @HedgeyeTV), have been outstanding. I learn a lot by trying to simplify complex topics like asymmetry, volatility, and power-laws. Lots to learn, together.
On the topic of what he calls the “power of power laws”, the aforementioned quote comes from The Brot of all fractal bots, Benoit Mandelbrot. Here’s his great statistical summary of how long-term markets prices haven’t fit the pattern of a bell curve:
“In fact, the bell curve fits reality very poorly. From 1916 to 2003, the daily index movements of the Dow Jones Industrial Average do not spread out on graph paper like a simple bell curve. The far edges flare way too high: too many big changes. Theory suggests that over time there should have been 58 days when the Dow moved more than 3.4%; in fact there were 1,001. Theory predicts 6 days of index moves beyond 4.5%; in fact there were 366. And index swings of more than 7% should come once every 300,000 years; in fact the 20th century saw 48 such days. Truly, a calamitous era that insists on flaunting all predictions.” (The Misbehavior of Markets, pg 13)

Back to the Global Macro Grind…
Inasmuch as market prices can “shock” people in a short period of time, they can do absolutely nothing for long periods of time. There is nothing “normal” (in bell curve terms) about risk managing markets. So study deliberately and embrace uncertainty.
Prior to last week, there had only been 5 trading days in the last 30 where the SP500 moved more than +/- 0.50%. Now, including yesterday’s “ramp” of +0.52%, the SP500 has had 2 up/down days of barely > 0.50% in the last week (one each way).
In other words in a sea of nothingness, if you were positioned net shorter (or less long) ahead of the -0.52% down day (AUG 24th) and then net longer (or less short) coming into yesterday’s +0.52% move, you did your job, selling (some) high and buying (more) low.
Gotta love the +/- 0.52% number btw. Right on the rails! Maybe someone centrally planned that.
Not to go all immediate-term TRADE on you this morning without contextualizing what I’m thinking about those moves within my intermediate and long term TREND and TAIL durations, but the dynamism of the short-term is why I built my “risk range” process.
If my inputs and assumptions for the immediate-term risk range were static, using bell-curve standard deviations of risk, my daily ranges would be a lot more wrong than they’ve been generally right.
To the contrary, I’m constantly resetting my inputs and assumptions based on real-time PRICE, VOLUME, and VOLATLITY. That’s why the risk ranges can be tightening some of the time and widening at other times. Currently, for the SP500, the risk range is tightening.
If a fund of fund wants to call this a “systematic strategy” within my multi-factor, multi-duration process, so be it. I call it a risk management overlay with some rules:
- When VOLATILITY is undergoing a PHASE TRANSITION from bearish to bullish, risk ranges are widening
- When VOLATILITY is undergoing a PHASE TRANSITION from bullish to bearish, risk ranges are tightening
And since I like it tight, tightening ranges are what I am looking for on the long side inasmuch as widening ranges are what I am looking for on the short side. Phase Transitions, don’t forget, are confirmed changes in intermediate-term TRENDs. They aren’t TRADEs.
Within the immediate-term TRADE duration there are a ton of head-fakes. That’s why I humbly submit you need both a fundamental research team and a set of potential calendar catalysts to be on the lookout for what aren’t head-fakes.
To put this in practical terms, let’s go through the SP500 setup one more time:
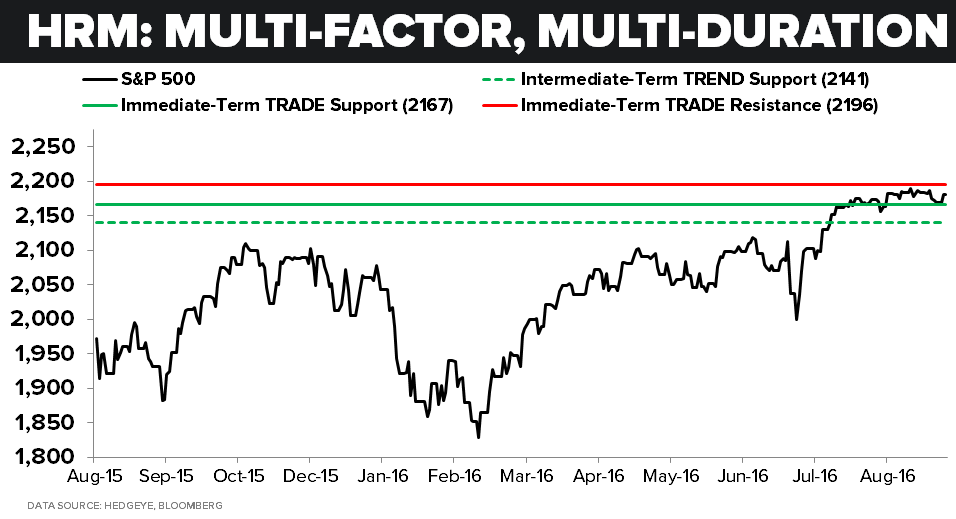
- It just had a text-book bounce off the low-end of my immediate-term 2167-2192 risk range
- It’s still signaling bullish from an intermediate-term TREND perspective (2141 support)
- It’s likely going to have a big move in/out of the US jobs report on Friday
If the jobs number is a bomb (Dollar Down, Rates Down), can stocks rip? Yes. If the jobs number is rainbows and puppy dogs (Dollar Up, Rates Up), can stocks get ripped? Yes. Can anything happen in between? Yes.
That’s the point. I won’t get every move right. But, provided that I know where I am in the risk range and what my pending catalysts are (however perverse their outcomes vs. “fundamentals” may be!), the better prepared I am for the un-predictable.
Or so me thinks at this stage of my career… Because, guess what? I’ve tried mostly everything else and this is the best I can do, so far, in trying to manage immediate-term risks within the ever bending and trending curve of economic gravity.
Our immediate-term Global Macro Risk Ranges (with intermediate-term TREND research views in brackets) are as follows:
UST 10yr Yield 1.50-1.62% (bearish)
SPX 2167-2192 (bullish)
RUT 1 (neutral)
NASDAQ 5175-5260 (bullish)
XOP 35.99-38.11 (neutral)
RMZ 1 (bullish)
Nikkei 165 (bearish)
DAX 100 (bearish)
VIX 11.25-14.36 (bullish)
USD 93.96-95.98 (bullish)
EUR/USD 1.11--1.13 (bearish)
YEN 99.34-102.45 (bullish)
Oil (WTI) 44.96-49.29 (bearish)
Nat Gas 2.53-2.97 (bullish)
Gold 1 (bullish)
Copper 2.05-2.15 (bearish)
Best of luck out there today,
KM
Keith R. McCullough
Chief Executive Officer