In the summer of 2014 we introduced our #volatilityasymmetry theme for our Q3 deck which turned out to be a, at minimum, a good call-out at all-time lows in cross asset volatility. Below we revisit that theme with a series of charts and tables outlining current behavioral bullishness (or lack of conviction on the short-side).
Highlights:
- Total U.S. market short-interest has been cut by 13% to a new YTD low currently (Feb. 2016 was the top, and July 2015 was the most recent trip to current levels).
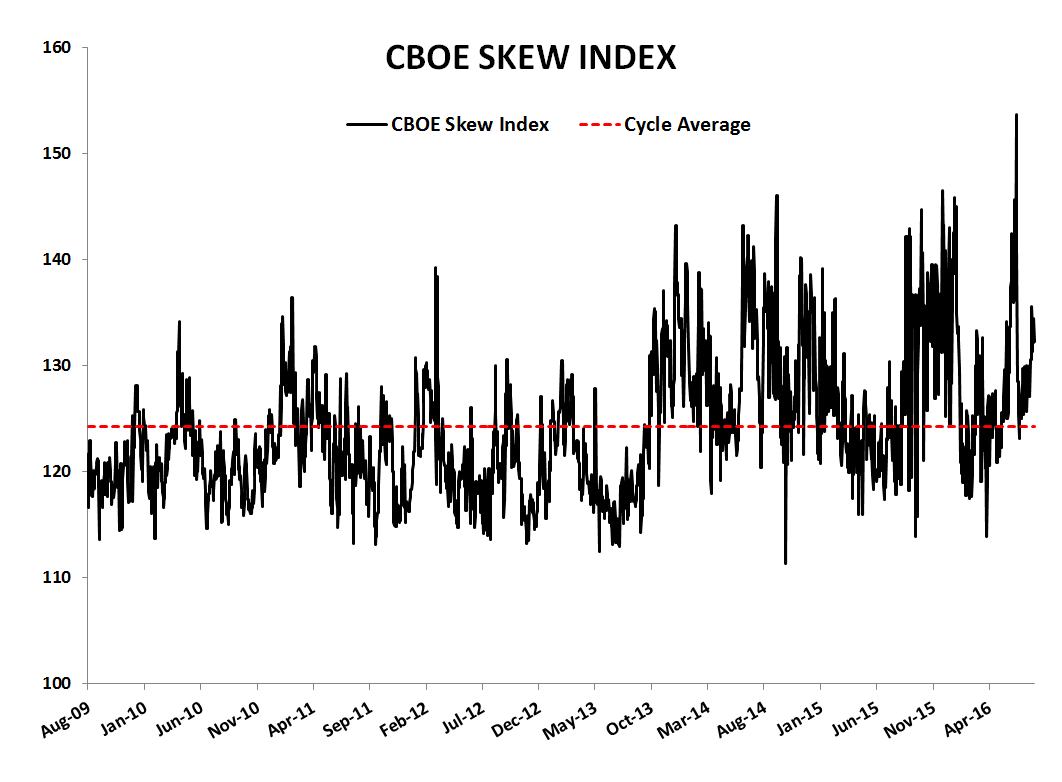
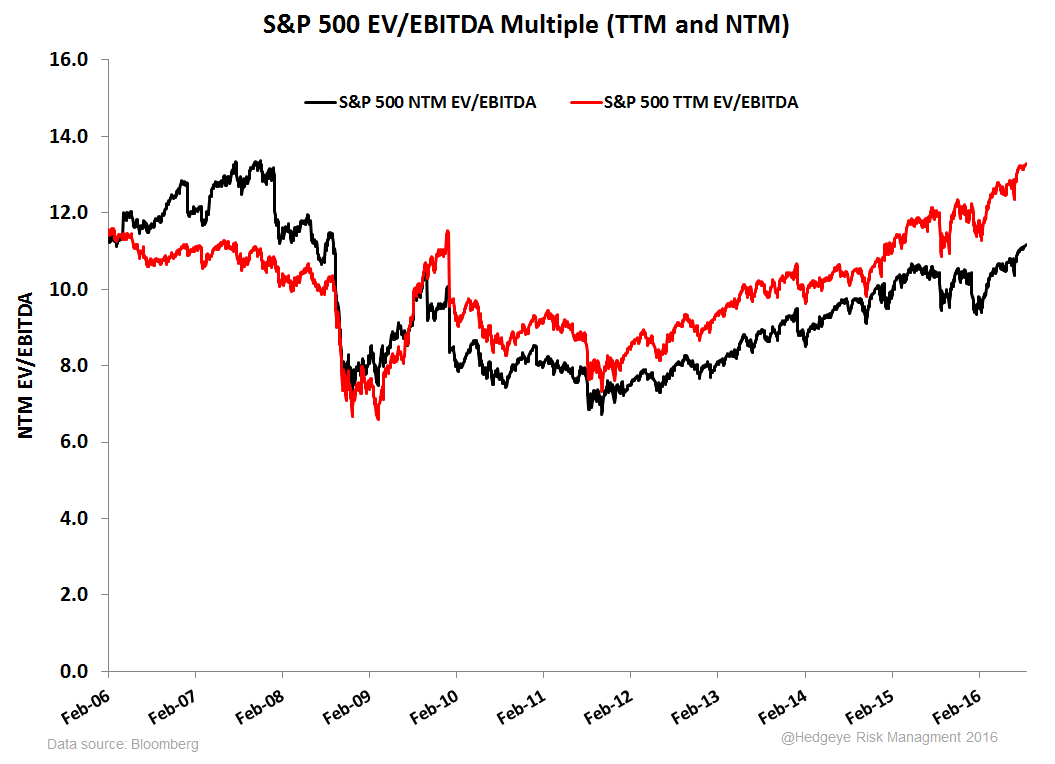
- With the market at all-time highs on peak forward multiples, realized shorter-term volatility in the S&P is at a level not seen since the summer of 2014 when the CBOE skew index was signaling a much more cautious market than it is now.
- Looking passed the VIX and S&P 500 implied volatility which is subject to ETF structuring and rebalancing ativity, implied volatility premiums over realized ranges have tightened further on a relative basis among a sample of S&P 500 constituents - this, despite realized volatility testing cycle low 2014 levels depending on the lookback window.
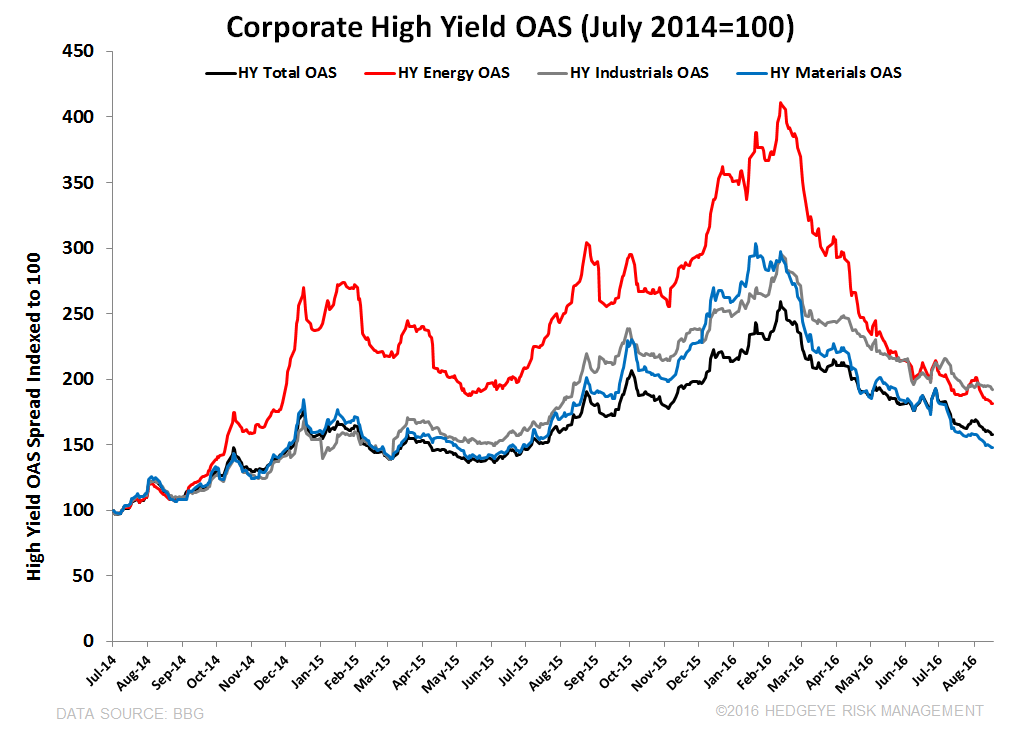
- The MOVE Index is at level not seen since 2014. Looking at high-yield credit in resource-related sectors, spreads have nearly tightened to broader indices when indexed to July 2014 (pre-USD breakout). With commodity-linked spreads tightening, net futures and options positioning among the 17 commodities we track on a weekly basis is registering a z-score >1x net long in 9 out of 17 commodities.
----------
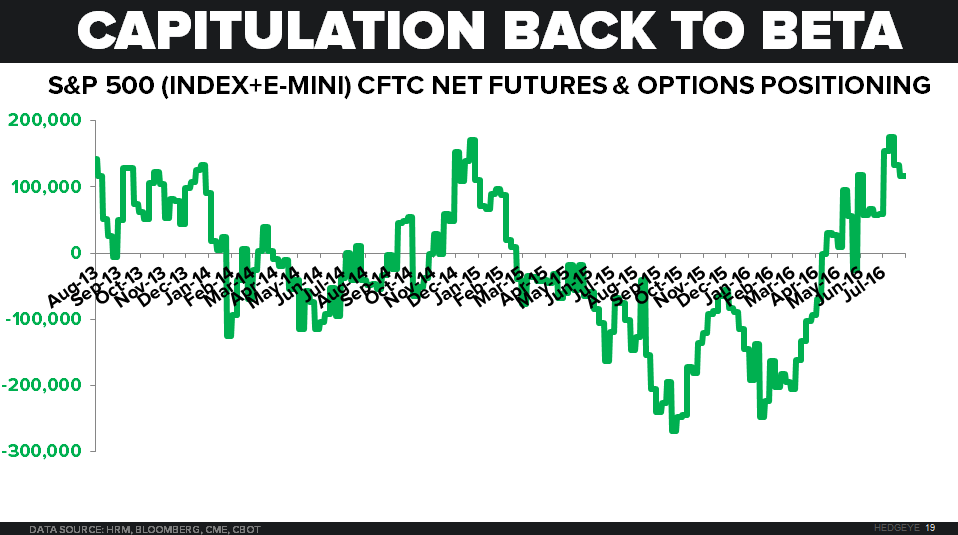
We speak of S&P 500 net non-commercial futures and options positioning regularly. Index + e-mini positioning has been cut the last couple of weeks, but it’s still pinned near a multi-year high. Along with futures and options positioning, total U.S. market short-interest has been cut 13% since February and the CBOE skew index indicates a market that is positioned much less cautiously than it was in the summer of 2014, at least in volatility terms:

Along with equity market volatility not far off cycle-lows, implied volatility across the treasury curve (MOVE INDEX) is at a new low not seen since 2014. Looking at commodity-leveraged sectors, spreads have reverted to the broader index since breaking out with the USD in July of 2014. Following the S&P and asset price reflation in general, of the 17 commodities for which we track net futures and options positioning on a weekly basis, 9 are registering net positioning a >1x on a TTM z-score basis (and that’s with the bearish seasonality affect at this time of year in grains):


And perhaps the most notable call-out, the following table looks at a random sample of 23 S&P 500 members, with a collective beta of 1.22. Short-interest has been cut over the last 6-months in 17 of those 23. Looking at Equity market skew, bombed out protection always has a bid, ESPECIALLY in the S&P. We realize it’s a more liquid and easier to trade in size. However, looking at overall levels of volatility (at-the-money implied vs. realized), realized vol. in the S&P is looking at taking out 2014 lows, and with it has gone the VIX.
Yet despite anemic volume and tightening ranges to all-time equity market highs, implied volatility in many of the names below has been hit harder than realized vol on a relative basis. The yellow columns furthest to the right look at the premium that implied is bid over realized ranges. Right now, despite the move to near cycle lows in realized volatility on the S&P (of course this depends on duration), 19 of 23 have implied volatility premiums that are >1x TIGHTER than 60D realized volatility. So forward-looking volatility premiums (over realized) are much tighter depsite near-cycle lows in trading ranges. We may expand the 23 to look at this more closely, but some of the offers look interesting if you’re skeptical this lasts.
As we mentioned in this morning’s early look, valuation multiples, while important, can look illogical for long periods of time, but getting a grasp on consensus positioning and sentiment is a key part of our the process. Whether by capitulation or forward-looking opinion, the move to beta is becoming increasingly a reality.


Ben Ryan
Analyst