Editor's Note: Below is a brief excerpt and chart from today's Early Look written by Hedgeye CEO Keith McCullough. Click here to learn more.
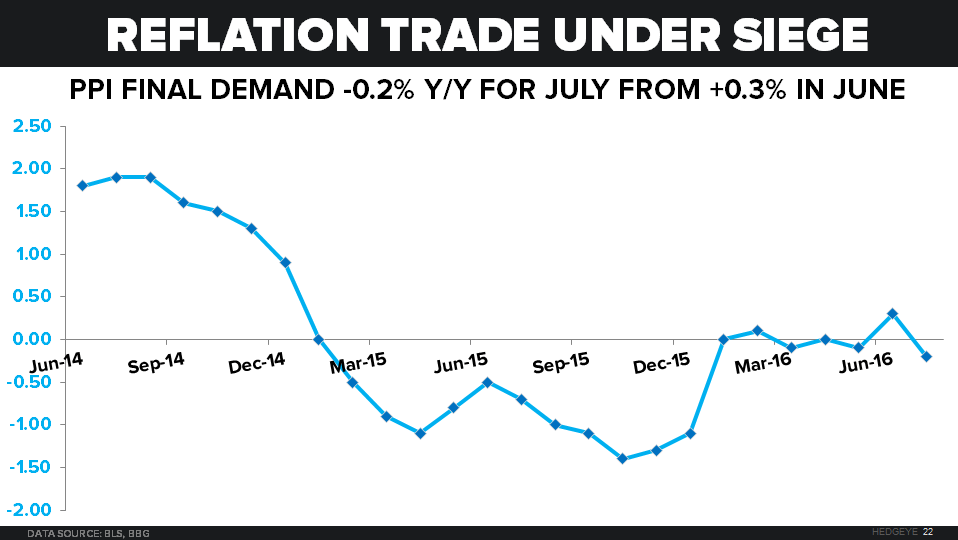
"... With the “reflation” trade under siege since peaking in early June, a -0.2% year-over-year Producer Price report for JUL (vs. +0.3% y/y in JUN) gave the market what it loves most when it can’t beat 1% GDP growth – Down Dollar, Down Rates:
- US Dollar Index ended the week down -0.5%
- US 10yr Yield fell 8 basis points on the week to 1.51%
- CRB Index and Oil reflated +0.5% and +6.4% on the week, respectively"