
The all-star break is over, and now the race to finish line moves into high gear. I’m not talking about the MLB. I’m talking about the post-convention 2016 political season.
This is the first of several pieces I’m going to write about the election.
Let me say at the outset that I get a lot of questions from readers about how Clinton v Trump fits into the predictive schema laid out in a couple of books I co-authored in the 1990s (Generations in 1991 and The Fourth Turning in 1997). I will respond to these questions in my upcoming notes.
Let me just say here, as a preview, that I regard the rise of Donald Trump and Bernie Sanders to be the most significant development in American politics going back to the early 1980s—not because of who Trump or Sanders are personally, but because of what their popularity says about a decisive mood shift in the electorate. (And not just here in America, but around much of the world.) In our earlier books, we foresaw this shift as driven by generational aging and occurring on a “seasonal” timetable that has demonstrated remarkable regularity through history.
In brief, since the middle of 2000-2010 decade, America has been moving into a “fourth turning era,” a winter season of history in which there arises a surging popular demand for community, public authority, national priorities, cultural tradition, and bottom-line results. There is an equivalent ebbing of popular interest in goals that had earlier been esteemed—such as individualism, personal rights, globalization, cultural transgression, and fair process.
Already, the Trump and Sanders movements have radically realigned the American political firmament. Trump, in one blow, has obliterated the party of culture-war social values, imperial globalism, and unregulated free agency. The new GOP stands for pragmatic social solutions, America-first isolationism, and solidarity with the working class.
Sanders, meanwhile, has pulled the Democratic Party far to the economic left and endowed its platform with vast new public agendas (including single-payer health, a universal right to college, and soak-the-rich tax rates) that few Democratic leaders previously contemplated, even as recently as 2012. And what Sanders started in the Democratic makeover, the sheer threat of Donald Trump has completed. Can anyone in living memory recall a Democratic convention with so many American flags and “USA” chants, so much talk about “American greatness,” so many appeals to “faith,” “family values” (thanks, Michelle), and law and order. At the same time the party is moving leftward economically, it is moving rightward socially.
Those who say the Democrats are just dressing up like the GOP to win middle America miss the point. For first time, Democrats know they have to dress up—imitation being the sincerest form of flattery. The same goes, by the way, for new-found GOP empathy for low-wage working America. (To Mitt Romney in 2012, as I recall, these were the mooching “47% of America” who got away without paying taxes.)
Readers of our books can fill in a lot more to complete this picture. Again, I will talk more about our turnings perspective in future notes. But here I want to focus on a more immediate and practical question: Which candidate is going to win? Or, to pose a more answerable question, how should we go about assessing the outcome odds?
Let me respond by conducting a brief tour through the techniques used by political forecasters. Yes, there is a community of forecasting professionals—and you better believe that November 11 will be a day that makes or breaks many of their careers.
I'll start with the econometric models, since these offer the earliest predictions. Econometric models assume that the winners of presidential elections are determined by a few easily observable economic and political indicators. Forecasters (typically economists and political scientists) develop the models by identifying a handful of such indicators and testing them with OLS regressions on historical elections—with some models tested all the way back to 1828. Given the limited N-size of historical observations, the number of tested variables is rarely greater than four or five.
Which variables work best? Nearly all the models include at least one variable measuring how long the incumbent party has been in office, because this favors the challenger. (Since Harry Truman, there have been 7 instances of an incumbent party holding the White House for two terms; the challenger has won in 6 of them.) Most also include at least one variable measuring recent economic performance (a good economy helps the incumbent). Other variables may include a recent favorability rating of the incumbent or the voting share won by each party in the most recent election.
Developing, testing, and publishing econometric election models has become a big deal in academia. The best models have 100% historical success rates—though again (I would caution) against a limited N size. Every election season, two scholarly journals run contests in order to rank and recognize the most accurate methods. In 2016, an unfamiliar de-syncing of economic indicators has put a strain on some of them. As measured by the unemployment rate delta, today’s economy seems to be doing well. As measured by real GDP growth, it’s doing poorly. (A less ambiguous indicator like real median household income might seem preferable, but series of this type don’t go back far enough in time to be helpful.)
So what do the econometricians say about Clinton v Trump? The best-known models give a decided edge to Trump. These include the Fair model (by Yale economist Ray Fair), the Time for a Change model (by Emory political scientist Alan Abramowitz), and the Primary Model (by Stony Brook political scientist Helmut Norpoth). According to Pollyvote, the average result from nine monitored econometric models has Trump winning the popular vote by one percentage point. Trump is helped by running against a two-term incumbent party, by generally lackluster economic data, by the incumbent’s only so-so favorability rating, and (per the Primary Model) by good turnout rates in his own party primaries.
For what it’s worth, some of the model authors aren’t entirely persuaded by the results of their own model. Abramowitz, in particular, has been widely quoted as saying that his model works for “normal” elections, but that 2016 is so unusual that he expects Trump will lose. Fair enough. You can go with the model or with the gut reaction of the modeler. What’s curious in this case is that it is typically Trump supporters who argue that this election is historically unusual (hence their optimism about overthrowing the “establishment”), not Clinton supporters.
A somewhat fuzzier cousin of the econometric model is the index model. Here the idea is to look at a variety of personal attributes of the candidates and at the “fit” between the issues voters care about and voter expectations that the candidates will be able to deal with them. One drawback of this approach is that we have no consistent definition of issues going back in time. Another drawback is that many of the personality attributes require qualitative judgment. In the index model proposed by Allan Lichtman (outlined in his widely read 1996 book, The Keys to the White House), for example, 2 of the 13 “keys” depend on the “charisma” of the incumbent or challenger. Really? Anyone have a charismometer handy?
Most of the index models predict Clinton over Trump. Two of them focus entirely on the fit between issues and voters. Tellingly, the model prioritizing the intensity of voter feeling on the most important issues generates a virtual tie in 2016 (Clinton wins by a mere 0.2% of the electorate). Another model that prioritizes the number of issues where voters and candidates are aligned generates a more comfortable Clinton lead (4.0%). Hillary will surely win among voters with policy checklists.
One unusual index model worth mentioning is the Bio-Index, developed by J. Scott Armstrong at Wharton and Andreas Graefe at Columbia. The authors test candidates against 58 biographical filters—everything from height and profession to perceptions of intelligence, books authored, and political track record. In 2016 the model predicts a massive margin of victory for Clinton (17.8%), and the margin is largely driven by Clinton’s superior respectability. She is a first born, is a lawyer, goes to church, comes from a “famous political family,” and has been a senator. Trump, by contrast, has an uncommon surname, has been divorced, went through bankruptcy, and so on.
It’s an unorthodox approach, but it does get at a novel shift in voter perception left untouched by other models: The Democrat is today the more respectable candidate. Who would have guessed? To be sure, the Bio-Index model is hardly foolproof. It could not possibly explain the popular-vote victory of Andrew Jackson over John Quincy Adams in 1824—nor even of Bill Clinton over George Bush, Sr., in 1992 (which Armstrong and Graefe concede was an outlier).
Survey-based predictions are no doubt the best known and most hotly contested method of forecasting. While the first statistically valid electoral surveys only date back to the late 1940s, they have since grown to dominate any media discussion of the likely winner or loser. In the early decades, a single poll (say, by Gallup or Harris) might hold forth for weeks as the “best” indicator of who was going to win. Today, thanks to low-cost digital survey tools, new national and state results are generated so frequently—typically several per day--that the half-life of even the biggest media poll can be measured in hours.
In response to this waxing flood tide of survey data, the media have begun to refer less often to single polls and more often to poll aggregators who digest and summarize all the incoming in one real-time scorecard. The aggregators, in turn, fall onto a long continuum. Some merely issue a simple average of the most recent national polls. Others go a bit further, and rebuild the electoral college outcome on the basis of the most recent state polls. Still others, at the other end of spectrum, subject the polls to extensive filtering and tweak the results according to their own personal judgment or their own quantitative modeling.
The most watched and cited vanilla aggregators are RealClearPolitics and Huffpost Pollster. Two other easy-to-navigate alternatives are Electoral Vote Predictor and Election Projection. The Wall Street Journal runs a clever site that includes an interactive “draw your own electoral college” map.
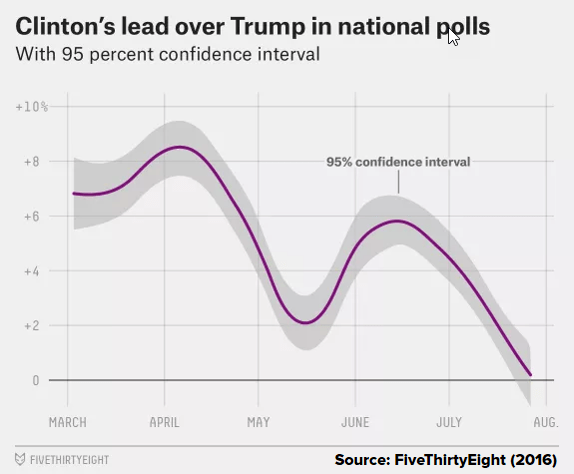
Overall, these simple survey aggregators point to a fairly tight race—though we are still in midst of “post-convention bounces” and temporary survey turbulence. According to RealClearPolitics, Clinton today holds a narrow voter lead of only 1.1% (44.5% to 43.5%). According to Huffpost Pollster with “more smoothing,” her lead is 1.9% (42.9% to 41.0%). What’s more, Trump has recently been gaining on Clinton. In late June, Clinton led Trump by 6% to 8%. But over the last month, the gap closed in two surges—the first a sharp decline in support for Clinton after FBI Director James Comey’s report on her email imbroglio, and the second a sharp rise in support for Trump during the GOP convention. Three days after Trump’s acceptance, RealClearPolitics gave Trump a 1% lead. Now that the Democratic convention is over, Clinton has regained the edge.

As goes the popular vote, so goes the electoral college—with only one exception (GW Bush v Al Gore) in the last 128 years. People are often surprised at how elections that are close in popular vote often lead to lopsided electoral college outcomes. In 2012, for example, Obama beat Romney by only 3.86% of the popular vote while romping him 332 to 206 in the electoral college. Yet this was less due to any adverse state-level gerrymander than to the simple fact that Romney lost several winner-take-all states by narrow margins. The same can be said for Trump. If he closes the popular vote gap with Clinton, he will likely win in Ohio and Florida. That leaves everything up to a cliffhanger in Pennsylvania. Or, if Trump loses there, a win in Michigan could be enough to produce a 269-269 electoral college tie. (Which would ultimately be decided, in his favor, by a GOP-leaning House of Representatives.)
OK, so much for the vanilla aggregators. Let’s turn to the more sophisticated survey-based predictors, those who “work” with the poll results to generate their own special election forecasts. Most of these are recognizable brands, with websites that may (or may not) show their latest findings to the public. They include The Princeton Consortium, Sabato’s Crystal Ball, The Cook Political Report, The Rothenberg & Gonzales Political Report, FiveThirtyEight, and The New York Times' Upshot.
One peculiarity about these sophisticated predictors (businesses, really) is that they publish their results not as vote margins but as outcome probabilities. Moving back and forth between the two requires some getting used to. Like the electoral college split, an outcome probability swings much more widely than a voter margin. For example, a 1.25% voter margin is typically associated with something close to a 60/40 probability estimate. A 3.50% voter margin is associated with a 70/30 estimate; a 6.00% voter margin with an 80/20 estimate; and so on.
So how do these big-name prognosticators weigh in? Most currently give the election to Clinton over Trump by odds of close to 70/30. You could interpret this as: Yeah, a Clinton victory is probable, but a Trump victory would be hardly unexpected. It would have about the same likelihood as a totally overcast day in Seattle. Or as Tom Brady missing a completion.
If you’ve read closely thus far, however, you might wonder: These odds translate into a 3.5% popular margin (or thereabouts), which is significantly greater than the margin now shown by any simple poll aggregator. What gives? The answer is unknowable. None of these sites disclose their methodology. They rely instead on their name recognition. They are… Charlie Cook, Larry Sabato, The New York Times. Need you know anything more? Big-name appeal points to another method of determining the winner, and that is simply to conduct a survey the best-known experts. Perhaps unsurprisingly, the most recent such survey (by PollyVote) showed a voter margin of almost 5 percentage points in favor of Clinton—back on May 31 when the polls were showing a Clinton voter margin of only 1 percent.
Among the sophisticated big-brand predictors, there are a couple of exceptions to the large Clinton margin. One is The Rothenberg & Gonzales Political Report, which apparently (though the results are not yet public) is putting the election as tied. The other is Nate Silver’s FiveThirtyEight, which is owned by ESPN (in turn owned by DIS). FiveThirtyEight's “polls-only forecast” also now calls the race just about even at 51/49. The FiveThirtyEight odds are worth serious attention because 38-year-old Nate Silver is a superstar among forecasters—the founder (when was with The New York Times) of what is now called “data journalism.” And his predictive track record is stunning: In 2008 and 2012, he correctly called 99 out of 100 states.
Why do the FiveThirtyEight odds differ from the rest of the pack? Hard to say, but it clearly has something to do with Silver’s obsessive and utterly data-driven methodology. FiveThirtyEight vets and adjusts every poll according to its statistical track record. It cross-correlates every state result with the (more frequently updated) national polls. Geographic, trend, and historical variables are then statistically superimposed on the result. FiveThirtyEight generates three sets of numbers: (1) a “now-cast,” which forces the computer to calculate the odds as if the election were held today; (2) a “polls-only” forecast, which is most comparable to the other data aggregators; and (3) a “polls-plus” forecast, which further adjusts the results according to assumptions about the impact of the economy, third parties, and patterns from earlier elections. (Currently, Silver’s polls-plus gives a modest 61/39 margin for Clinton.)
A colorful subplot in the 2016 forecasting contest is the public acrimony between Silver and the Upshot, run by The New York Times (his former employer). Apparently, Jim Rutenberg of the Upshot has taken Silver to task for his inattention to the “human” and “emotional” side of elections and for focusing on “data” only. Silver has responded in kind. With the Upshot tilting 70-30 toward Clinton at the moment, it will interesting to see who needs to (ahem) “re-adjust” between now and November 11.
Finally, there are the election betting markets—or, to use a more dignified term, the “political futures” markets. Election betting has a long and storied history. Indeed, between the 1870s and the 1930s, there was a vibrant New-York based market for betting on U.S. presidential elections. And remarkably, before the advent of any scientific polling, these markets nearly always picked the winner. Since the 1940s, election betting has fallen into regulatory disfavor. A traditional argument for allowing them—giving the public news about the expected outcome—no longer matters now that the media can cite the polls.
The CFTC currently permits U.S. residents to trade in only two political futures markets. Both have excellent websites that allow visitors to track the odds. One is the Iowa Electronic Markets, run by the University of Iowa since 1988. The other is PredictIt, run by Victoria University in Wellington, New Zealand. Both markets claim to be “educational” in their purpose and put a strict limit (of $500 and $850, respectively) on any betting contract. Some other countries allow less regulated markets. A large number of political oddsmakers are based in London, including Betfair and Ladbrokes. Oddschecker allows you to review quickly all the odds being offered in London on the 2016 U.S. election. Election Betting Odds helpfully translates the odds from bookie-speak fractional odds (like “4/9 for Clinton”) into probability percentages.
Because these are markets, they tend to gravitate to one price. Though global artitrage is difficult, since cross-border trades are often barred by regulators, it inevitably happens. So what is that price? Right now, you can buy a $1 Clinton future for about 67 cents or a $1 Trump future for about 33 cents. Which means that the market odds are very similar to what most of the expert aggregators (ex FiveThirtyEight and RGPT) are quoting.
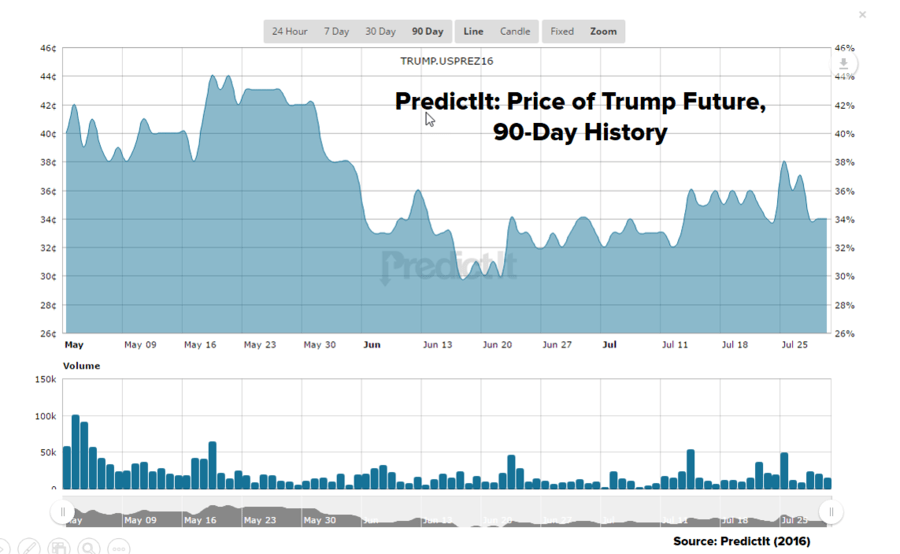
So let me ask the same question about betting markets that I asked earlier about the expert aggregators: Why are they imputing a significantly larger vote margin for Clinton than is indicated by the opinion polls? Even more curiously, why is this extra margin growing over time? Back in late May, Trump was about as close to Clinton in the polls as he is today. But back then, Trump futures were selling for 43 cents, 10 cents higher than they are today. For any given poll result, the markets seem to be imputing a rising “unelectability” discount onto Trump’s candidacy.
One partial exception is the forecast provided by Hypermind, an unusual betting market in which participants “bet” with points rather than money (though winners get occasional prizes) and the participant pool of 2,000 are regularly evaluated for their predictive accuracy. The least accurate participants are kicked out, and new members are invited in off a waiting list. The goal is to create a community of “superforecasters”—to borrow from Tetlock and Gardner—whose powers exceed those of ordinary futures markets. And according to Hypermind's own data, it has achieved that goal. So where does Hypermind put the 2016 odds? At about 60/38 for Clinton, a significantly narrower margin than the regular markets.
No one should dismiss betting markets. They have an impressive track record. They routinely beat a naïve look at the latest national poll. Their ability to harness the tacit knowledge of vast numbers of participants has been hailed in such bestsellers as James Surowiecki’s The Wisdom of Crowds and Cass Sunstein’s Infotopia.
On the other hand, betting markets aren’t perfect. Their biggest recent embarrassment was Brexit. Right up the end, the markets favored Remain by 75/25. Yet Brexit not only won, it won by a 4 percent margin in the popular vote. Had that margin been priced in the markets, the odds probably would have been north of 90/10. Sure, you can always say that an event priced at 10 percent or 5 percent will still sometimes happen—once every ten or twenty times. Thus, if it happens, you can’t be sure the odds were off. Still, forecasters live or die by their biggest calls. When they seem to get things wrong, the public doesn’t have the patience to evaluate dozens of similar calls.
So let’s try to sum all this up. What can we say about all these diverse means of forecasting the coming election? I offer two main takeaways.
First, if you look strictly at the data and if you drain your brain of all the emotions and gut feelings surrounding this election (in other words, if you put on your Nate Silver game face), you’d have to say this is a very close race. Models that translate the election into objective historical parameters—like incumbency, economic growth, etc.—actually give Trump a decided edge. The poll numbers are also neck and neck. Yes, Clinton does have a slight lead, but over the last month Trump has been mostly gaining on her.
Second, to the extent that forecasters are adjusting the data-driven results according to their own intuition and qualitative guessing, they are almost always pushing the odds in Clinton’s favor. They may be entirely correct in doing so. I’m a strong believer in intuition: It’s the stuff that makes political futures markets work so well. But if we want to know whether to trust these intuition-guided forecasters, we have to do some guessing of our own. We have to figure out what is triggering their misgivings about the GOP candidate in 2016.
Where to begin? Almost everything about Donald Trump generates disbelief. His difficulty articulating top-down policy positions. His peevish and bullying grandiosity. His closed and suspicious world view. His unfiltered stream-of-consciousness speaking style. His limited vocabulary, using mere word repetition to add stress. Educated voters, even those who support him, hold their breath when he talks.
OK, I’m guessing here. But I think forecasters continue to regard Trump as a powder keg about to go off, just one horrible gaffe or scandal away from a complete disintegration of his campaign. That’s when they suspect American voters will wake up and wonder what the heck were they thinking. I don’t think this is just the view of Clinton partisans. Across the board, forecasters sense that Trump’s downside risk has a fat tail.
Then again, recall that no prominent forecaster ever foresaw Trump winning the candidacy to begin with. And this points to a more favorable way to look at Trump: Maybe he's the new breed of post-modern leader, perfectly aligned with the era we are now entering. Complex policy positions: Why bother, since politicians only use them to conceal and lie? A dark world view: Who doesn’t feel that America is on the wrong track? Unplugged and unfiltered: Americans thirst for connection and intimacy. Simple words: Soundbites (e.g., “no borders, no country”) are actually more accountable than complex paragraphs. As for the fatal gaffe, what shocks anybody in a world where even 70-year-old retirees tune in to Howard Stern? Maybe Trump knows something that the forecasters don’t: What’s really shocking is that we are all beyond shock.
Trump’s candidacy thus becomes more plausible if one believes, as I do, that the prevailing social mood in America is rapidly changing. Donald Trump (and Bernie Sanders) are “pre-seasonal,” to use a term I sometimes give to public figures who anticipate the new direction. Hillary Clinton, by contrast, is “post-seasonal,” her outlook firmly rooted in the old regime while struggling gamely to adapt.
So net-net, what do I think the odds are for 2016? I'd say they're closer than the betting markets suggest. Veteran pollster and former Clinton advisor Douglas Schoen argues in a recent Wall Street Journal essay that Hillary Clinton actually leaves Philadelphia an "underdog" in the race. (He's clearly not one of the experts surveyed by Pollyvote!) More than Trump, Schoen says, Clinton has to worry about an enthusiasm deficit among her supporters, especially among Millennials.
Good point, but I can't go that far. Trump remains the underdog. I’d go with the estimate produced by FiveThirtyEight’s polls-plus model and by Hypermind. I’d say 60/40 Clinton. But that’s actually pretty close. You’d have to flip a 60/40 coin a lot of times before you figure out it isn’t 50/50.
Of course, these odds can and will change, day by day. The post-convention turbulence is still high. I suspect the poll numbers will settle over the next two weeks.
If you want to keep up with these changes on your own, here are four sites I recommend bookmarking: Nate Silver’s FiveThirtyEight; The New York Time’s Upshot (which includes a great real-time overview of alternative forecasts); the poll survey in RealClearPolitics; and the betting odds on PredictIt. We’ll revisit all this soon.
