“When the market diverges from its historical trends, eventually it reverts back to the mean.”
-Richard Thaler
“Eventually” is a good word for an academic or legitimately “long-term investor” to use. That way they don’t have to get the timing and/or risks right. That said, being blind to #TheCycle for the last 20 years has been very painful for those chasing equity market tops.
Thaler’s quote comes from my old professor, Robert Shiller, in a great chapter in Misbehaving called “The Price Is Not Right” (pg 234). Where I grew up in this business (a hedge fund that had an intermediate-term TREND duration to ideas), last price was always right.
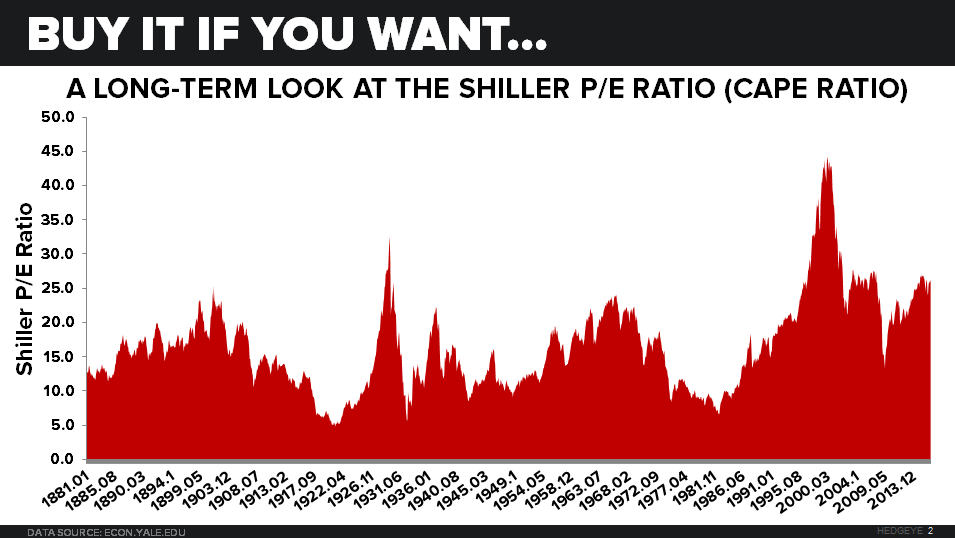
Longer-term though, on something like P/E ratios, Shiller has been proven right. Today’s Chart of The Day is a picture Shiller emblazoned into my thick but impressionable skull in the 1990s. It reminded me that today’s US stock market “multiple” looks like it did in 1929 (you can find Shiller’s long-term mean reversion and behavioral research at www.econ.yale.edu/~shiller/).
Back to the Global Macro Grind…
At this price (i.e. the all-time closing high of 2166), even if you believe the “E” (Earnings) embedded in the SP500’s multiple, this is a Top 3 most expensive stock market in US history.

While valuation is typically not a catalyst, until central-market-planners take it away from me, it’s still something I have the personal freedom and liberty to not chase. If you’re paid to consider it with other people’s money, that’s a different compensation exercise.
If you’ve owned the SP500’s YTD return of 6%, that’s great. It’s nothing exciting (like Gold and Utilities +25.9% and +20.5% YTD, respectively), but it sure beats getting paid nothing at all. No matter how you were positioned, what matters is what you do from here.
Back to the “E”…
- So far 43 of 500 companies in the SP500 have reported GAAP and non-GAAP earnings
- In the aggregate (including the generally unaccepted storytelling #s) y/y EARNINGS are down -7.1% QTD
- Financials (-8.3%) and Tech (-15.4%) lead losers, underperforming the -7.1% aggregate
But no worries, most of the banks “beat.”
Yep. Fully loaded with non-GAAP trickery and deceit, they “beat” the soft bigotry of low expectations (apologies to George Bush for borrowing one of his best quotes to describe the RNC, DNC, and Old Wall).
But that doesn’t change the fact that the “E” I’m using for a stock market that’s as expensive as it was before the 1929 crash is the wrong “E.” Imagine we used the right number?
Pre-EPS season, the GAAP multiple for the SP500 was about 25x. And pre-EPS season, Consensus Macro was trying to make the call that “earnings have bottomed” based on some of the following factors:
- Over-indexing what they “ex-d out” (Energy) from last year’s earnings, “Oil is up” (but down 5% in the last month)
- “The US Dollar is down” (even though now it’s up year-over-year)
- “The Consumer is hanging in” (that part is actually true, if you don’t deflate what they’re buying to report real growth)
You see, that’s the magic in talking up how a “weak dollar” is giving us +2.3% year-over-year inflation (CPI) … you can’t subtract that inflation from American cost of living (from nominal growth) and print real, inflation adjusted growth. That way, ex-Main St., all good.
But what’s real anymore when it comes to storytelling about “the market” vs. the real economy anyway?
Another by-line about “the consumer” is that they’re still re-ramping their old levered spending binge on big stuff like autos and homes. If you ask the builders though (NAHB reported its JUL #s yesterday), this is what the numbers say:
- NAHB Builder Confidence of 59 in JUL (vs. #TheCycle’s rate of change peak in OCT 2015 of 65)
- NAHB Sales Activity of 63 in JUL (vs. #TheCycle’s rate of change peak in OCT of 2015 of 70)
There are 2-ways to read those numbers: A) like we do - going from great to good is bad (great time to book gains if you’ve killed it long #Housing for the last few years) OR B) like they do - good is good because everything is always good.
And that leads me to the full circle on the point of this morning’s note. Whether you missed it or nailed it, is buying the all-time high in anything good? Maybe if you’re a super duper short-term chart chaser… maybe it feels good…
But, for my money… from here… I’m not betting that “it’s different this time” and that we don’t have another one of what’s become quite common now for a year in US Equity Beta – i.e. a big mean reversion (lower) AFTER the VIX taps 12.
Our immediate-term Global Macro Risk Ranges are now:
UST 10yr Yield 1.31-1.63%
SPX 2110-2190
NASDAQ 4
VIX 12.01-17.14
USD 96.00-97.11
Gold 1
Best of luck out there today,
KM
Keith R. McCullough
Chief Executive Officer