
Key Takeaway:
Extreme optimism took hold last week, especially with Bank of England officials advising that they expect to launch fresh stimulus next month, J.P. Morgan and Citigroup beating earnings expectations, U.S. retail sales coming in higher than expected, and Chinese economic growth coming in higher than expected at 6.7%. Almost all of our risk measures in the heatmap below eased week over week, most of them significantly. The heatmap is also positive on the intermediate and long term.
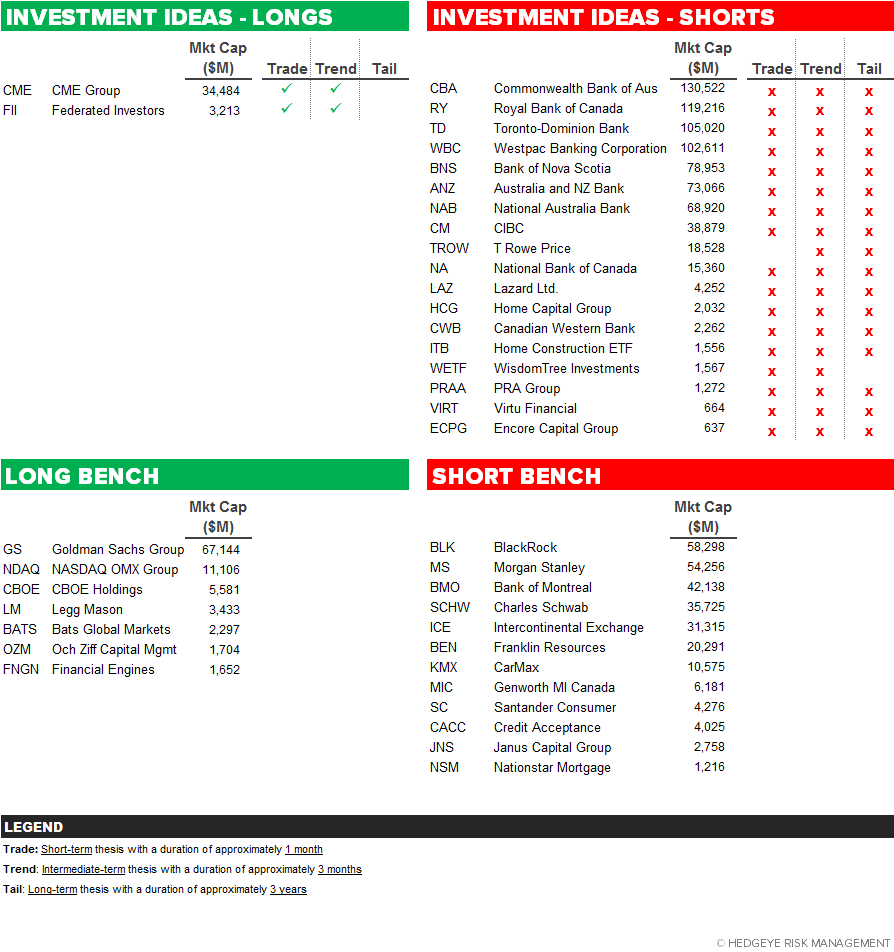
Current Ideas:
Financial Risk Monitor Summary
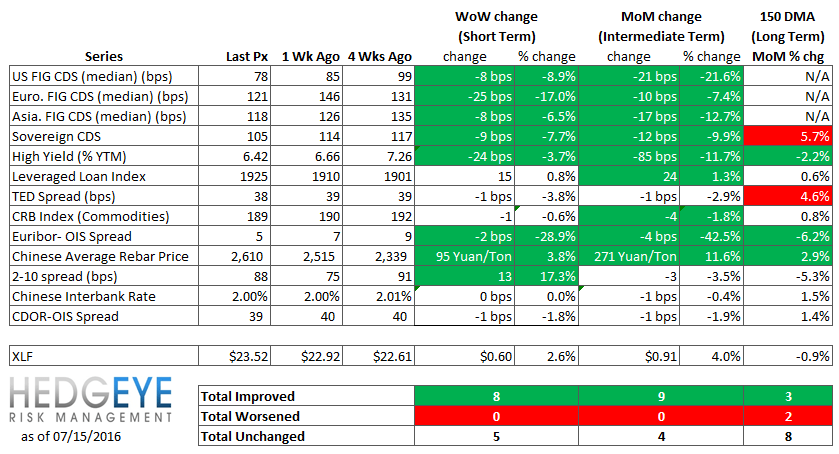
• Short-term(WoW): Positive / 8 of 13 improved / 0 out of 13 worsened / 5 of 13 unchanged
• Intermediate-term(WoW): Positive / 9 of 13 improved / 0 out of 13 worsened / 4 of 13 unchanged
• Long-term(WoW): Positive / 3 of 13 improved / 2 out of 13 worsened / 8 of 13 unchanged
1. U.S. Financial CDS – Swaps tightened for 13 out of 13 domestic financial institutions. With J.P. Morgan and Citigroup beating earnings expectations, retail sales coming in higher than expected, and Brexit fears giving way to elation over future BoE stimulus, the median domestic financials CDS tightened by -8 bps to 78.
Tightened the most WoW: AIG, MS, PRU
Widened the most WoW: ACE, CB, MTG
Tightened the most WoW: JPM, BAC, C
Widened the most MoM: AGO, ACE, SLM

2. European Financial CDS – Financials swaps mostly tightened in Europe last week as the reality of slowing growth and a likely British recession gave way to elation over future BoE stimulus.

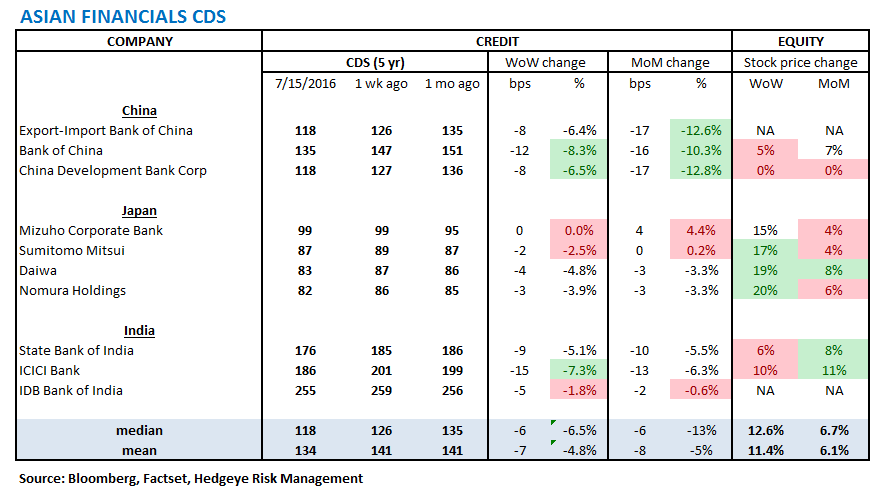
3. Asian Financial CDS – With relief provided by a weakening Yen and Chinese economic growth coming in higher than expected at 6.7%, all financials swaps in Asia tightened last week, with the exception of Japanese Mizuho CDS, which did not trade.
4. Sovereign CDS – Sovereign swaps mostly tightened over last week. Portuguese swaps tightened the most, by -26 bps to 288.


5. Emerging Market Sovereign CDS – Emerging market swaps were propelled tightener last week by better-than-expected Chinese economic growth. The average CDS change was -13 bps.

6. High Yield (YTM) Monitor – High Yield rates fell 24 bps last week, ending the week at 6.42% versus 6.66% the prior week.

7. Leveraged Loan Index Monitor – The Leveraged Loan Index rose 15.0 points last week, ending at 1925.

8. TED Spread Monitor – The TED spread fell 1 bps last week, ending the week at 38 bps this week versus last week’s print of 39 bps.

9. CRB Commodity Price Index – The CRB index fell -0.6%, ending the week at 189 versus 190 the prior week. As compared with the prior month, commodity prices have decreased -1.8%. We generally regard changes in commodity prices on the margin as having meaningful consumption implications.

10. Euribor-OIS Spread – The Euribor-OIS spread (the difference between the euro interbank lending rate and overnight indexed swaps) measures bank counterparty risk in the Eurozone. The OIS is analogous to the effective Fed Funds rate in the United States. Banks lending at the OIS do not swap principal, so counterparty risk in the OIS is minimal. By contrast, the Euribor rate is the rate offered for unsecured interbank lending. Thus, the spread between the two isolates counterparty risk. The Euribor-OIS spread tightened by 2 bps to 5 bps.

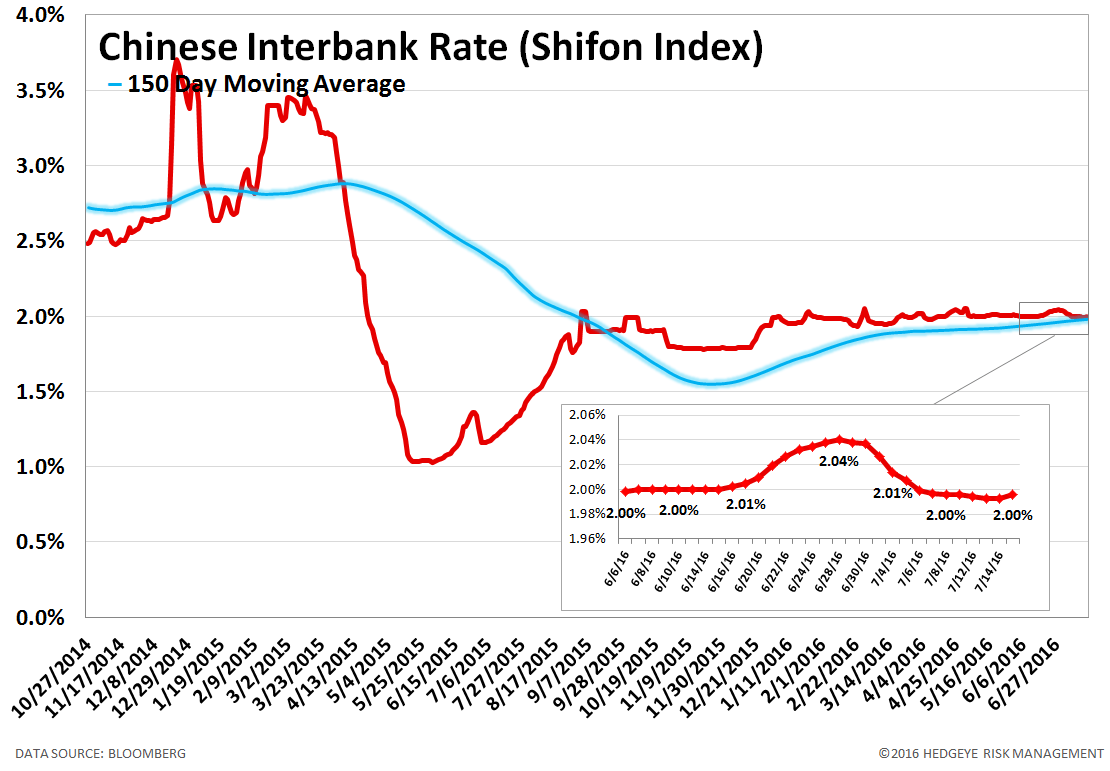
11. Chinese Interbank Rate (Shifon Index) – The Shifon Index fell 0 basis points last week, ending the week at 2.00% versus last week’s print of 2.00%. The Shifon Index measures banks’ overnight lending rates to one another, a gauge of systemic stress in the Chinese banking system.
12. Chinese Steel – Steel prices in China rose 3.8% last week, or 95 yuan/ton, to 2610 yuan/ton. We use Chinese steel rebar prices to gauge Chinese construction activity and, by extension, the health of the Chinese economy.

13. Chinese Non-Performing Loans – Chinese non-performing loans amount to 1,392 billion Yuan as of March 31, 2016, which is up +41.7% year over year. Given the growing focus on China's debt growth and the potential fallout, we've decided to begin tracking loan quality. Note: this data is only updated quarterly.

14. Chinese Credit Outstanding – Chinese credit outstanding amounts to 151.0 trillion RMB as of June 30, 2016 (data released 7/14/2016), which is up +15.3 trillion RMB or +11.3% year over year. Month-over-month, credit is up +1,514 billion RMB or +1.0%. Note: this data is only updated monthly.

15. 2-10 Spread – Last week the 2-10 spread widened to 88 bps, 13 bps wider than a week ago. We track the 2-10 spread as an indicator of bank margin pressure.

16. CDOR-OIS Spread – The CDOR-OIS spread is the Canadian equivalent of the Euribor-OIS spread. It is the difference between the Canadian interbank lending rate and overnight indexed swaps, and it measures bank counterparty risk in Canada. The CDOR-OIS spread tightened by 1 bps to 39 bps.

Joshua Steiner, CFA
Jonathan Casteleyn, CFA, CMT
Patrick Staudt, CFA