
“If everything was perfect, you would never learn and you would never grow.”
-Beyonce Knowles
Last week, after registering 4 consecutive all-time closing highs in a row, US Equity Beta (SP500) was almost perfect. On Friday (Day 5), it lost -0.09%, closing at 2161. That’s +1.65% higher than where it was one year ago today.
Perfect was not my macro market “call” last week. Unless we define all of my macro longs being down on the week (and all of my macro shorts being up) as perfectly terrible, that is…
If everything was perfect, I’d never have to timestamp any ideas or themes. My macro teammates and I would never learn or grow.
Back to the Global Macro Grind…
Depending on how you’re positioned, you might find our call on US GDP this morning almost perfect. It’s high enough to take out the GDP recession risk (for now), and won’t be reported in time for the Fed to have to tighten on it…
After Friday’s US Retail Sales sequential (month-over-month) acceleration to +2.7% year-over-year, our GIP (Growth, Inflation, Policy) predictive tracking algorithm has ramped to a YTD high forecast of +2.3% year-over-year for Q2.
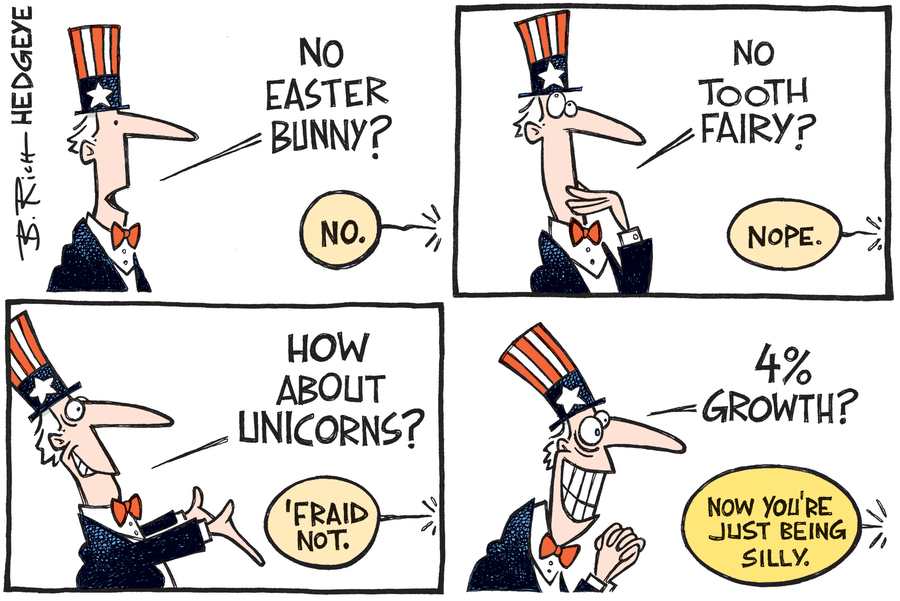
If we extrapolate that into a forecast that would resonate with Wall St. (they like to read GDP on a quarter-over-quarter SAAR basis), US GDP could be as high as +3-4% in Q2. If you’ve been looking for that number for a year now, that’s almost perfect too!
A few points on why we’ve been revising GDP higher throughout the quarter:
- The government has been understating “inflation” in both GDP and PCE Consumption reports
- When you understate inflation, you can overstate “real” consumption and GDP growth
A real-world example of this is Retail Sales. Because it’s reported nominally, lower gas prices actually drag on reported growth while higher prices – despite acting as a tax on real consumption – actually manifest as stronger reported growth.
In addition to thinking through the timing of a better than expected Q2 GDP report: A) don’t forget that our call on the #ProfitCycle Recession remains on the other side of it and B) GDP up sequentially in Q2 means down again, sequentially, in Q3.
For Q3 2016 our current GIP model is tracking:
- GDP year-over-year growth of +1.9-2.1%
- GDP quarter-over-quarter SAAR of 0.8%
In other words, not too hot (so the Fed won’t raise rates) and not too cold (so you don’t yet have to freak out about a US #Recession and sell your charts). If the government reported real GDP using the right Deflator, we’d already be in a recession…
But, heh, it’s an election year!
Another way to look at this is that I have an almost perfect explanation for why our favorite S&P Sector setup got crushed last week (Utilities -1.0% vs. Financials +2.6%).
If our math is right, sequentially accelerating GDP growth (Q2 vs. Q1) should manifest into rising bond yields (from all-time lows) inasmuch as slowing growth (Q3 vs. Q2) should result in a reversion back to the TREND of falling yields.
CONTEXT: don’t forget that it literally took a full year for Consensus Macro to agree with us on our call for an all-time low long-term US Treasury Yields. Right on time though, with net positioning at its LONGEST position of 2016, the 10-year Yield ramped +19 basis points last week. Here’s how that positioning looks (CFTC Futures & Options data):
- 10YR TREASURY: net LONG position +27,841 contracts week-over-week to +114,702 contracts
- The 3 month and 1 year average net positions for the 10YR are net SHORT -21,166 and -6,260, respectively
- On a 1-year z-score that +114,702 net LONG position is a perfect +2.00x
Yep. Right on the screws, perfect. Any time a macro position is plus or minus 2.0x, our sentiment model says fade the directional move in whatever that position is, for a TRADE… then you either buy/sell more (post correction) if the TREND remains.
Nope. It’s not easy nailing every counter-TREND move (i.e. immediate-term TRADES) and staying with the intermediate-term TREND itself. Over time, it’s not only “not easy” – it’s impossible.
That said, the goal of the game is perfection. And when I can define most of my daily/weekly mistakes using economic and market data, I’m happier than I’d be if I was always wrong but rarely sure and/or honest as to why.
Our immediate-term Global Macro Risk Ranges are now:
UST 10yr Yield 1.31-1.61%
SPX 2106-2187
NASDAQ 4
VIX 12.02-17.23
USD 95.66-96.98
Oil (WTI) 43.77-47.27
Gold 1
Best of luck out there today,
KM
Keith R. McCullough
Chief Executive Officer

