

Over the past 2 years, growth in financial traders has outpaced growth in commodities traders according to the weekly CFTC Committment of Traders Report. The number of commodities traders has grown +14% while financial traders have grown over 1.5x that rate, by +22%. Even more dramatic is the impact on all important open interest. While commodities trader growth of +14% has had a one-to-one effect on OI expanding an equivalent +14%, financial trader growth of +22% has effected open interest expontentially with a +51% expansion. This reinforces our long view on financials heavy CME Group (CME), the open interest for which now sits at 110.5 million, up +21% YTD versus only +3% OI growth at Intercontinental Exchange (ICE). CME Group stock finally punched through $100 a share this week, up over +12% year-to-date (before a +5% fully loaded dividend) versus just +2% return for ICE.


Weekly Activity Wrap Up
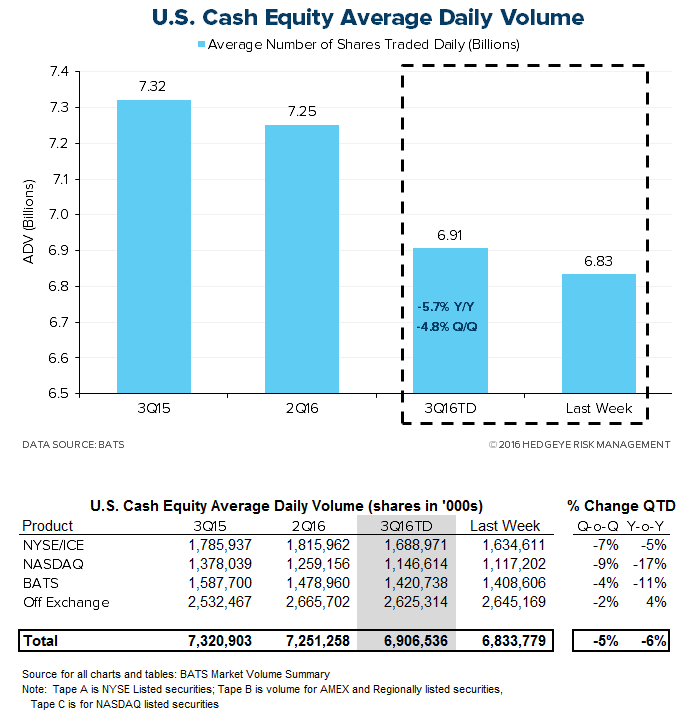
Volume for futures and options came in higher week over week. Futures activity came in at 20.3 million contracts per day, bringing the 3Q16TD average daily volume (ADV) to 19.8 million, +6% Y/Y growth. Options activity came in at 17.4 million contracts per day. However, the 3Q16TD ADV remains -10% lower than the year-ago quarter at 16.3 million. Cash equities came in lower week over week at 6.8 billion shares per day, bringing the quarter's ADV to 6.9 billion, -6% lower than 3Q15.

U.S. Cash Equity Detail
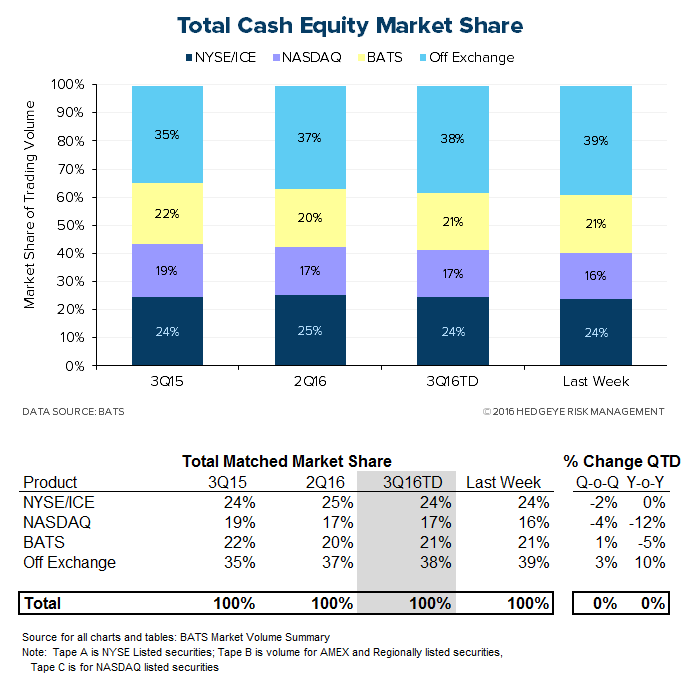
U.S. cash equities trading came in at 6.8 billion shares per day this week, bringing the 3Q16TD ADV to 6.9 billion, -6% lower than the year-ago quarter. The market share battle for volume is mixed. The New York Stock Exchange/ICE is taking a 24% share of third-quarter volume, which is just about in line with the year-ago quarter, while NASDAQ is taking a 17% share, -222 bps lower than one year ago.
U.S. Options Detail
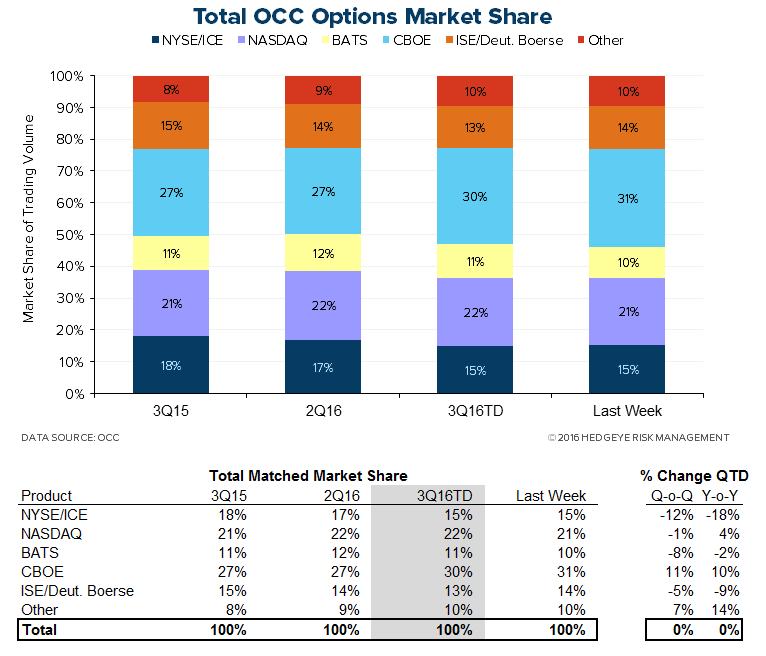
U.S. options activity came in at a 17.4 million ADV this week, bringing the 3Q16TD ADV to 16.3 million, -10% lower than the year-ago quarter. In the market share battle amongst venues, NYSE/ICE's 14% share of 3Q16 volume is -315 bps lower than one year ago. Additionally, while BATS' share grew in the first half of 2016, growth has stalled somewhat in recent weeks, and the exchange's 11% share is -27 bps lower than the year-ago quarter. Meanwhile, NASDAQ's 22% share is +85 bps higher than in 3Q15, and CBOE's 30% market share of 3Q16 is up +276 bps Y/Y. Finally, ISE/Deutsche's 13% share is -139 bps lower than 3Q15.

U.S. Futures Detail
15.8 million futures contracts per day traded through CME Group this week. That puts the 3Q16TD ADV at 15.3 million, +7% higher Y/Y. Additionally, CME open interest, the most important beacon of forward activity, currently sits at 110.5 million CME contracts pending, good for +21% growth over the 91.3 million pending at the end of 4Q15, an expansion from the previous week's +18%.
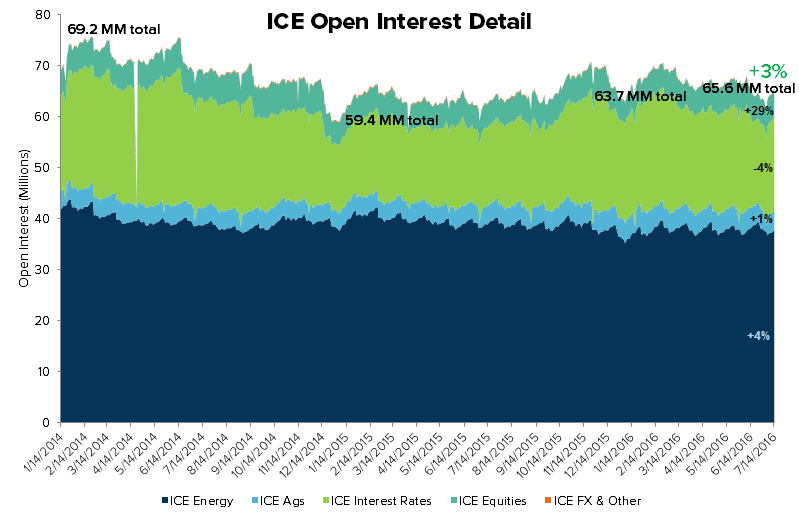
Contracts traded through ICE came in at 4.5 million per day this week, pushing the 3Q16TD ADV to 4.4 million, a +4% Y/Y expansion. ICE open interest this week tallied 65.6 million contracts, +3% higher than the 63.7 million contracts open at the end of 4Q15 and an expansion from the previous week's 1%.


Monthly Historical View
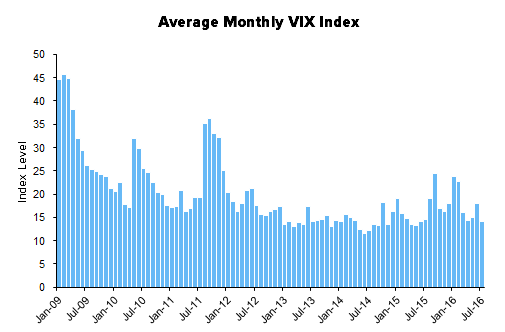
Monthly activity levels give a broader perspective of exchange based trends. As volatility levels, measured by the VIX, MOVE, and FX Vol should rise to normal levels after the drastic compression this cycle, we expect all marketplaces to experience higher activity levels.


Please let us know of any questions,
Jonathan Casteleyn, CFA, CMT
Joshua Steiner, CFA
Patrick Staudt, CFA
