Editor's Note: Below is a brief excerpt and chart from today's Early Look written by Hedgeye CEO Keith McCullough. Click here to learn more.
"... Whereas, both Long-term Sovereign Bonds and their equity market proxies did the following:
- US Treasury 10-year Yield dropped another -12 basis points on the week to 1.44% (down -83bps YTD)
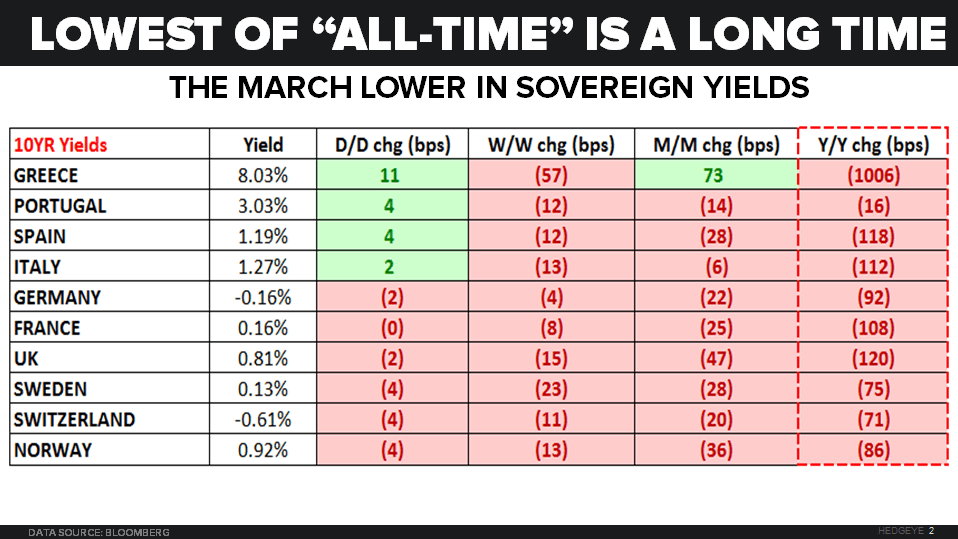
- UK 10-year Yield crashed another -22 basis points on the week to 0.86% (down -110bps YTD)
- Germany’s 10yr Yield dropped back to negative, falling -8bps on the week to -0.13% (down -76bps YTD)
- Japan’s 10yr Yield fell another -8 basis points on the week to -0.25% (down -52bps YTD)
- Low Beta US Equities ramped another +3.7% on the week to +14.0% YTD
- High Yield US Equities added another +3.1% on the week to +7.4% YTD
- MSCI REITS Equity Index rose another +4.3% on the week to +11.5% YTD
- US listed Utilities (XLU) added another +3.7% on the week to +21.3% YTD
*for 5 and 6, that’s the mean performance of Top Quintile vs. Bottom Quintile SP500 Companies"