

Investment Company Institute Mutual Fund Data and ETF Money Flow:
Optimism leading up to the Brexit vote caused equity outflows to ease somewhat in the 5-day period ending June 22nd, although total equity mutual funds still put in a -$3.8 billion net withdrawal. Equity ETF inflows of +$1.3 billion brought total equity mutual fund and ETF flows to -$2.6 billion. Meanwhile, investors poured +$10.2 billion into fixed income mutual funds and ETFs, which was the category's best week since June 24, 2015. Money market funds, which experienced -$4 billion in outflows were likely a source of funds for that subscription to fixed income. Given the result of the Brexit vote, we expect defensive reallocations to continue and intensify in next week's survey.

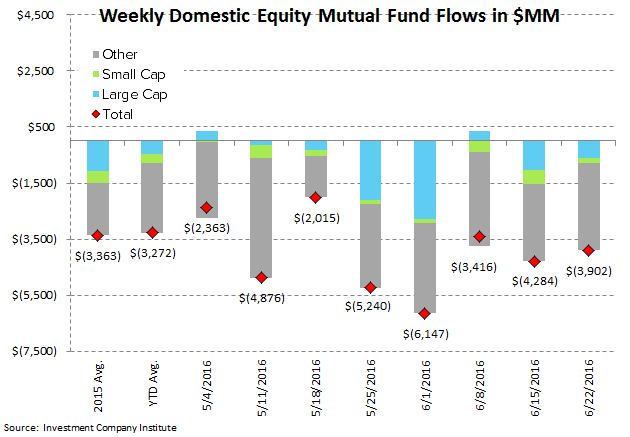
In the most recent 5-day period ending June 22nd, total equity mutual funds put up net outflows of -$3.8 billion, trailing the year-to-date weekly average outflow of -$2.7 billion and the 2015 average outflow of -$1.6 billion.
Fixed income mutual funds put up net inflows of +$3.3 billion, outpacing the year-to-date weekly average inflow of +$2.5 billion and the 2015 average outflow of -$475 million.
Equity ETFs had net subscriptions of +$1.3 billion, outpacing the year-to-date weekly average outflow of -$779 million but trailing the 2015 average inflow of +$2.8 billion. Fixed income ETFs had net inflows of +$7.0 billion, outpacing the year-to-date weekly average inflow of +$1.6 billion and the 2015 average inflow of +$1.0 billion.
Mutual fund flow data is collected weekly from the Investment Company Institute (ICI) and represents a survey of 95% of the investment management industry's mutual fund assets. Mutual fund data largely reflects the actions of retail investors. Exchange traded fund (ETF) information is extracted from Bloomberg and is matched to the same weekly reporting schedule as the ICI mutual fund data. According to industry leader Blackrock (BLK), U.S. ETF participation is 60% institutional investors and 40% retail investors.
Most Recent 12 Week Flow in Millions by Mutual Fund Product: Chart data is the most recent 12 weeks from the ICI mutual fund survey and includes the weekly average for 2015 and the weekly year-to-date average for 2016:


Cumulative Annual Flow in Millions by Mutual Fund Product: Chart data is the cumulative fund flow from the ICI mutual fund survey for each year starting with 2008.


Most Recent 12 Week Flow within Equity and Fixed Income Exchange Traded Funds: Chart data is the most recent 12 weeks from Bloomberg's ETF database (matched to the Wednesday to Wednesday reporting format of the ICI), the weekly average for 2015, and the weekly year-to-date average for 2016. In the third table are the results of the weekly flows into and out of the major market and sector SPDRs:


Sector and Asset Class Weekly ETF and Year-to-Date Results: In sector SPDR callouts, the utilities XLU ETF took in +$214 million or +3% last week.

Cumulative Annual Flow in Millions within Equity and Fixed Income Exchange Traded Funds: Chart data is the cumulative fund flow from Bloomberg's ETF database for each year starting with 2013.


Net Results:
The net of total equity mutual fund and ETF flows against total bond mutual fund and ETF flows totaled a negative -$12.8 billion spread for the week (-$2.6 billion of total equity outflow net of the +$10.2 billion inflow to fixed income; positive numbers imply greater money flow to stocks; negative numbers imply greater money flow to bonds). The 52-week moving average is -$2.7 billion (negative numbers imply more positive money flow to bonds for the week) with a 52-week high of +$20.2 billion (more positive money flow to equities) and a 52-week low of -$19.0 billion (negative numbers imply more positive money flow to bonds for the week.)

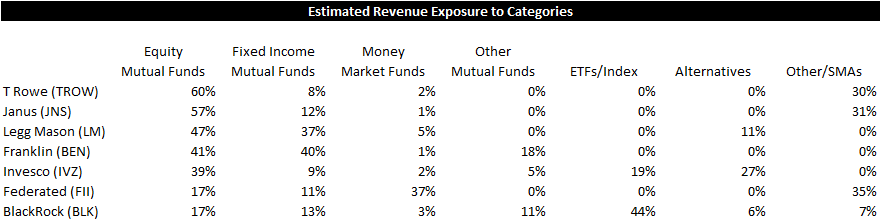
Exposures: The weekly data herein is important for the public asset managers with trends in mutual funds and ETFs impacting the companies with the following estimated revenue impact:
Jonathan Casteleyn, CFA, CMT
Joshua Steiner, CFA
Patrick Staudt, CFA
