“Look man. I lay it out for y'all to play it out”
-Huggy Bear, Starsky & Hutch
For the last six weeks or so I've been a reluctant participant in a kind of bizarro Seinfeld'ian reality.
Perhaps the stars have aligned in the elusive Kumbaya formation or the universe is seeking to balance European dissonance with humanistic harmony in my backyard.
Whatever the reason, I’ve been unwittingly ensnared in the great Hug-nado of 2016.
It’s not that I’m against hugging.
It’s just that as I’ve been introduced to new families in town the last couple months, the hugging – sometimes with the same people multiple times per day – has somehow spiraled in reflexive, self-reinforcing fashion to the upside. I’ve actually had to increase my advil consumption to guard against rotator cuff inflammation from repetitive high frequency hugging.
Anyway, I’m pretty sure central CT is experiencing a localized embracing bubble. Since I plan on living here for a long time, I hope the inevitable de-hug-eraging is well managed to a soft landing.

Back to the Global Macro Grind…
If you feel like you've been a reluctant participant in a bizarro parallel macro dimension where policy maker forecasts are wrong every time, attempted front-running of policy initiatives born of those errant forecasts = “investing”, and where consensus & futures go from pricing in 3-5 rate hikes to a rate cut in a matter of weeks as price/risk discovery and free market clearing devolve into farcical versions of themselves, fear not …..
Yesterday we received the final estimate of 1Q16 GDP.
Positive revisions to the Trade balance and Nonresidential Investment drove the upside in net exports and Investment expenditure and the bulk of the positive revision to the headline.
On the flip side Consumption growth was revised down by -40bps with growth across each of Services/Durables/NonDurables seeing negative revisions of similar magnitude.
Notably, the GDP deflator was also revised lower by -0.2%, providing a sizeable support to the positive revision. In total, since the advance estimate of 1Q16 GDP on 4/28, the deflator has been revised lower by -0.3% while headline GDP has been revised higher by +0.6%.
It could be argued whether this is a completely clean way to contextualize it, but it could be fairly contended that suspect inflation inputs have been responsible for a full 50% of the positive revision we’ve seen to growth in the 1st quarter.
Quickly, for those unfamiliar with the GDP deflator.
101: First recall that nominal values are values priced in units of currency (a function of volume and price/price changes) while real values are values priced in units of goods & services. We care about real values because, as consumers, we’re concerned less about total spending than about with how many goods and services we can consume. Real values are arrived at by subtracting price changes (i.e. “The GDP Deflator”) from nominal spending:
The GDP price deflator is considered “implicit” in the sense that it’s calculated simply as the ratio of Nominal GDP/Real GDP. In words,
- GDP Price Deflator = Nominal GDP/Real GDP *100 => this give the index value
- QoQ Deflator = Index Value in Current Qtr/Index Value in Prior Qtr -1 * 4 => This is QoQ price change, annualized and the figure used in deflating reported Nominal GDP.
Also remember that, by convention, all data are typically reported quarter-over-quarter, seasonally adjusted and annualized (SAAR = seasonally adjusted annual rate).
If you’re ever unsure how to understand a reported GDP metric, remember the BEA mantra, “If in Doubt, SAAR It Out”.
To be clear, I don’t think the inflation understatement is conspiratorial, I just don’t think it accurately reflects the underlying reality for most households.
For example, consider the Fed’s preferred inflation measure – Core PCE inflation. In contrast to the GDP price deflator which was down -0.5% QoQ in 1Q (0.9% in 4Q15 vs. 0.4% in 1Q16), Core PCE inflation was +0.7% higher in 1Q16 (2.0% in 1Q16 vs 1.3% in 4Q15 ).
If nominal growth were deflated using this “preferred measure” real growth would be measurably negative and real GDP per capita even more negative.
Is this a better reflection of reality where progress towards the Fed’s inflation target is a product not of demand-pull inflation as the economy pushes towards productive capacity but of excess cost growth in key consumer cost centers like housing and healthcare?
I don’t know, but evidence suggests widespread household margin pressures remain acute.
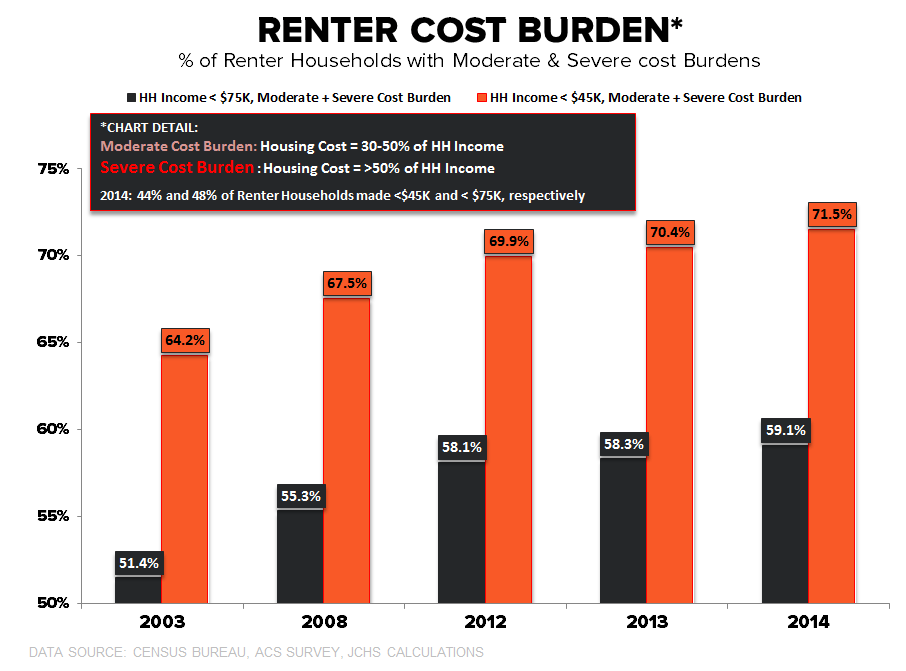
On the housing side specifically, the affordability crisis is building. For the ~43M renter households in particular the percent with moderate and severe cost burdens continues to make all-time highs.
Per the latest JCHS housing report:
- 71.5% of Households making <$45K pay more than 30% of income to housing with 42.1% paying more than 50%
- 59.1% of Households making <$75K pay more than 30% of income to housing with 32.3% paying more than 50%
As can be seen in the Chart of the Day below, almost half of all renter households make less than $75K so the incidence of moderate and severe cost burdens is the prevailing reality for over 20 million households.
And as housing’s share of wallet grows, capacity for other discretionary consumption declines proportionally. Indeed, severely cost burdened households spend more on transportation costs and significantly less on Food, Healthcare and retirement savings.
Further, with shelter inflation making a new cycle high in May and continuing to grow at a premium to both income and broader inflation growth, the share of cost burdened renters will only get worse when the 2015 & 2016 data are officially reported.
Now, having fulfilled my bearish humpday research quota, some marginally bullish data to balance and close ….
May PCE: We’ll get the household income and spending figures for May this morning. The sum of aggregate hours and earnings growth from the NFP report point to a modest deceleration in aggregate salary and wage income growth (and flattish consumption growth by extension).
Consensus is looking for consumption to grow +0.4% sequentially. With retail sales +0.5% MoM in May that’s not an unreasonable estimate. Further, the lack of a negative revision to the April Retail Sales data reduces the likelihood that the notable rise observed in the April Spending data gets revised lower.
If the April spending data remains unrevised, the +0.6% gain equates to a +2.9% gain in 2Q (remember, you have to annualize the QoQ change) even if total spending growth is flat month-over-month in May and June. In other words, consumption would be a material support to reported growth on the quarter.
While consumption in 2Q is likely to be “good”, that goodness deserves some context.
A sequential improvement in consumption growth would be in the context of a larger trend towards deceleration. It’s also worth noting that the deceleration in consumption growth off the 1Q15 rate-of-change peak has occurred despite accelerating credit growth as consumer re-leveraging has proven unable to fully offset the deceleration in employment and income growth.
Further, implicit in extrapolating a ongoing acceleration in consumption growth is an assumption for further acceleration in credit growth, a complete re-inflection in the employment and income cycles (which isn’t how those cycle work), significant wage inflation and a dismissal of decelerating global growth, tighter financial conditions, and renewed prospects for strong dollar deflation and EU spillover effects.
To channel Peter Thiel to close: It’s 2016, we were promised flying cars. We got high frequency hugging, Brexit and peak rent inflation.
Our immediate-term Global Macro Risk Ranges are now:
UST 10yr Yield 1.41-1.61%
SPX 1
VIX 16.84-25.68
EUR/USD 1.09-1.12
Gold 1
To growth,
Christian B. Drake
U.S. Macro Analyst