

Key Takeaway:
Our risk monitor is an interesting animal in that it typically signals risk emerging in non-equities arenas before that risk is reflected in equity prices. Sometimes, however, it works in reverse. Equities get whipsawed, but the various risk monitor signals we track, while directionally consistent, can be characterized as "not impressed". Looking across the different signals this past week, one would assume that nothing overly significant happened. In fact, you'd be hard pressed to point to anything especially out of the ordinary. Either this means Brexit has smaller ramifications than what was priced into equities or these other signals are the lagging indicator(s).
It's obviously difficult to answer this question as no one seems to have a firm grasp on Brexit's longer-term implications for US economic growth, European economic growth, British economic growth, etc. From our vantage point, the big risk facing US investors is not Brexit, but the clear and present deterioration in credit quality and conditions in the US lending market. The lending cycle is very much in its twilight with numerous red flags beginning to arise. We think this should be where investors are focused.
Our heatmap below is mostly negative across all durations.
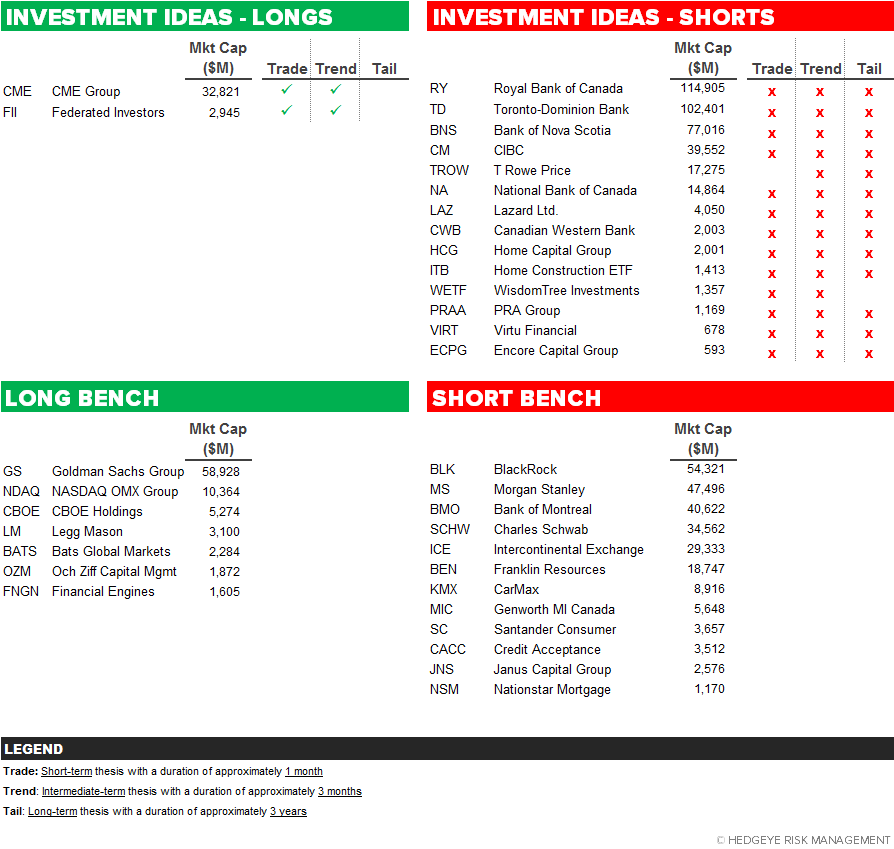
Current Ideas:
Financial Risk Monitor Summary
• Short-term(WoW): Negative / 3 of 13 improved / 4 out of 13 worsened / 6 of 13 unchanged
• Intermediate-term(WoW): Negative / 3 of 13 improved / 7 out of 13 worsened / 3 of 13 unchanged
• Long-term(WoW): Negative / 2 of 13 improved / 3 out of 13 worsened / 8 of 13 unchanged

1. U.S. Financial CDS – Swaps widened for 8 out of 13 domestic financial institutions. Although equity valuations reacted extremely negatively to the Brexit vote, most financials CDS outside large moneycenters seem to either indicate a delayed reaction or that default risk has not risen much. Moneycenter CDS widened by an average 2 bps while consumer finance and insurance companies' CDS tightened by an average -1 bps. On the other hand, outside financials, both the investment grade and high yield North American CDS indices at the bottom of the following table widened notably, by 4 bps to 87 and by 7 bps to 459 respectively.
Tightened the most WoW: MET, COF, PRU
Widened the most WoW: JPM, HIG, BAC
Widened the least WoW: GNW, MBI, AGO
Widened the most MoM: MS, JPM, GS

2. European Financial CDS – Financials swaps mostly widened in Europe last week as investors recognized the economic implications of the Brexit vote. The median CDS widened significantly, increasing by +9bps to 145.

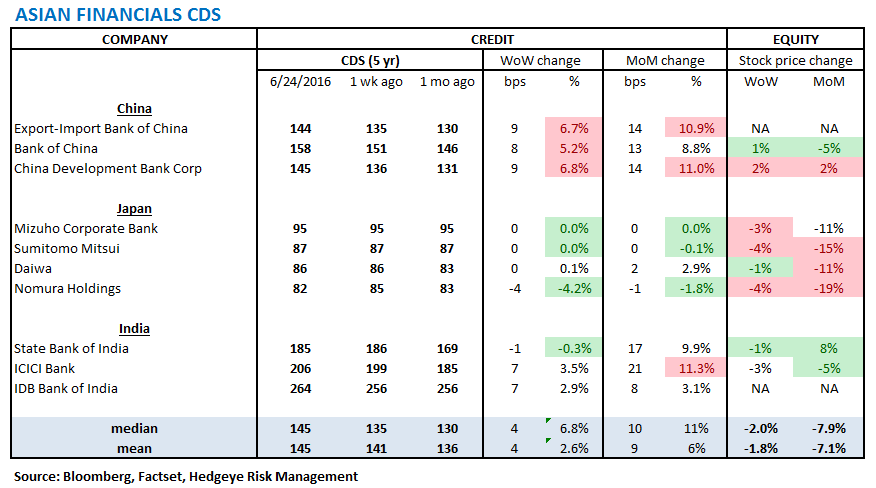
3. Asian Financial CDS – While bank CDS in Japan were mostly flat last week, 2 out of 3 Indian banks saw CDS widen, and all 3 Chinese banks saw their CDS widen.
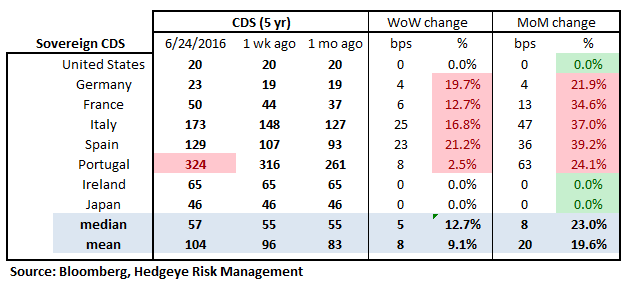
4. Sovereign CDS – Sovereign swaps mostly widened over last week. Post-Brexit vote, investors are most concerned with Italy and Spain, where CDS widened by +25 bps to 173 and by +23 bps to 129, respectively.

5. Emerging Market Sovereign CDS – Emerging market swaps mostly widened last week, although movement was fairly mild. The median EM CDS widened by only 1 bps to 189.

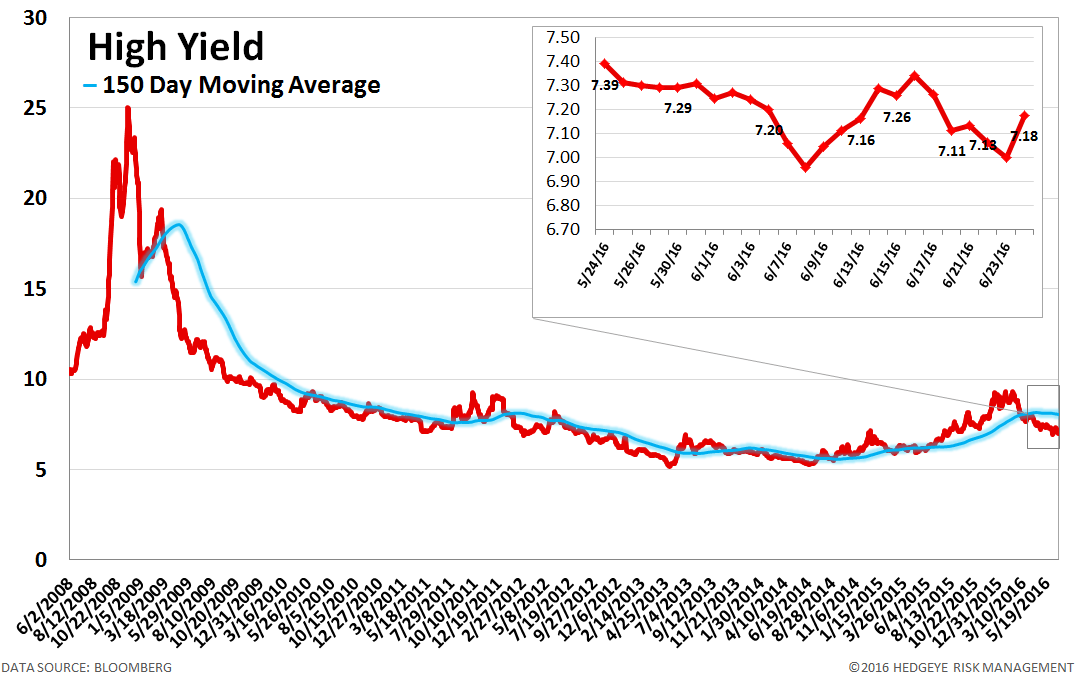
6. High Yield (YTM) Monitor – High Yield rates fell 9 bps last week, ending the week at 7.18% versus 7.26% the prior week.
7. Leveraged Loan Index Monitor – The Leveraged Loan Index fell 6.0 points last week, ending at 1895.

8. TED Spread Monitor – The TED spread was unchanged last week at 39 bps.

9. CRB Commodity Price Index – The CRB index fell -1.6%, ending the week at 189 versus 192 the prior week. As compared with the prior month, commodity prices have increased 1.4%. We generally regard changes in commodity prices on the margin as having meaningful consumption implications.

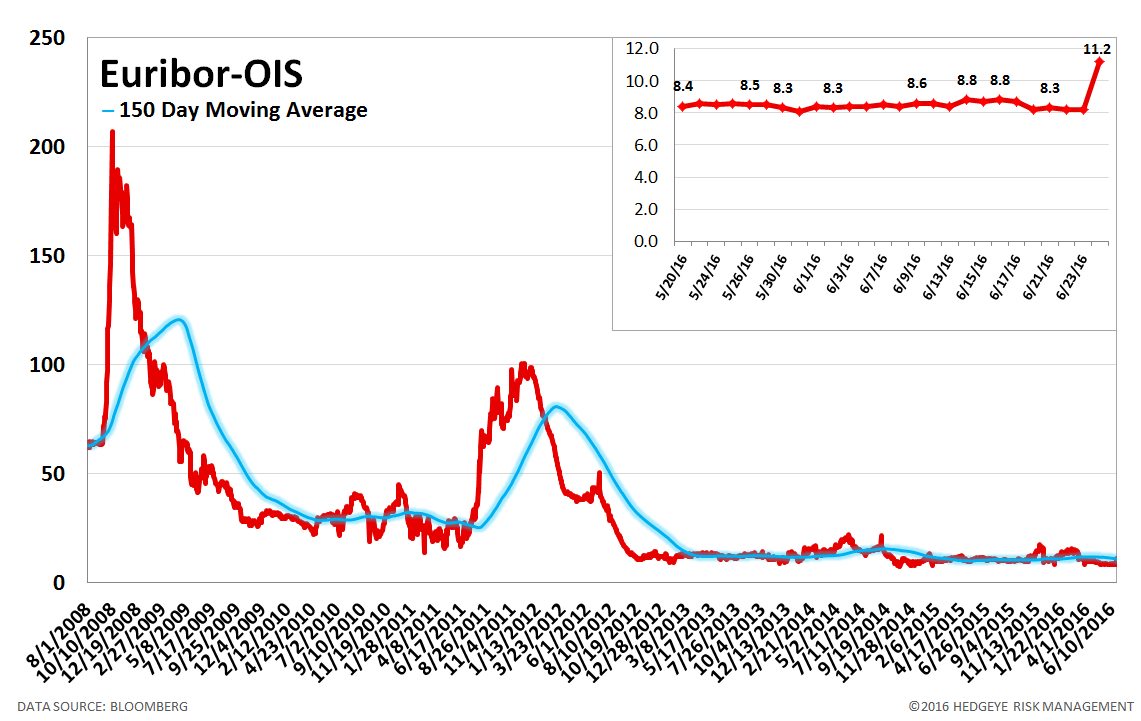
10. Euribor-OIS Spread – The Euribor-OIS spread (the difference between the euro interbank lending rate and overnight indexed swaps) measures bank counterparty risk in the Eurozone. The OIS is analogous to the effective Fed Funds rate in the United States. Banks lending at the OIS do not swap principal, so counterparty risk in the OIS is minimal. By contrast, the Euribor rate is the rate offered for unsecured interbank lending. Thus, the spread between the two isolates counterparty risk. The Euribor-OIS spread widened by 3 bps to 11 bps.
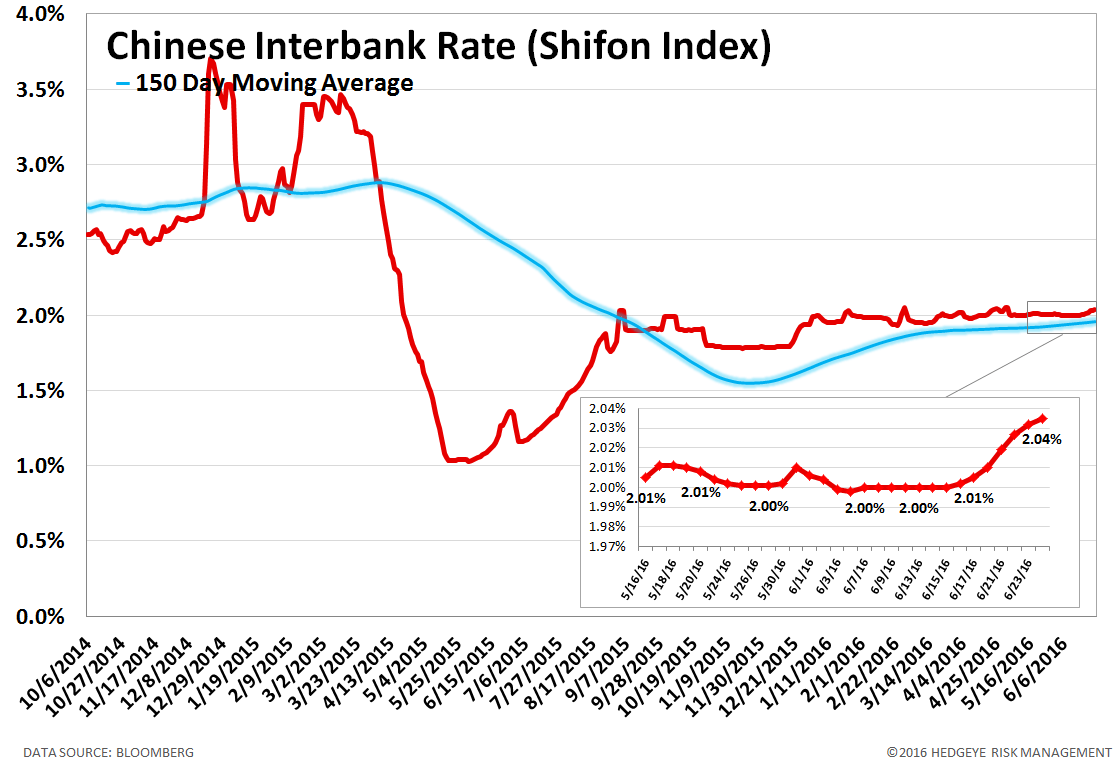
11. Chinese Interbank Rate (Shifon Index) – The Shifon Index rose 3 basis points last week, ending the week at 2.04% versus last week’s print of 2.01%. The Shifon Index measures banks’ overnight lending rates to one another, a gauge of systemic stress in the Chinese banking system.
12. Chinese Steel – Steel prices in China rose 0.4% last week, or 10 yuan/ton, to 2349 yuan/ton. We use Chinese steel rebar prices to gauge Chinese construction activity and, by extension, the health of the Chinese economy.

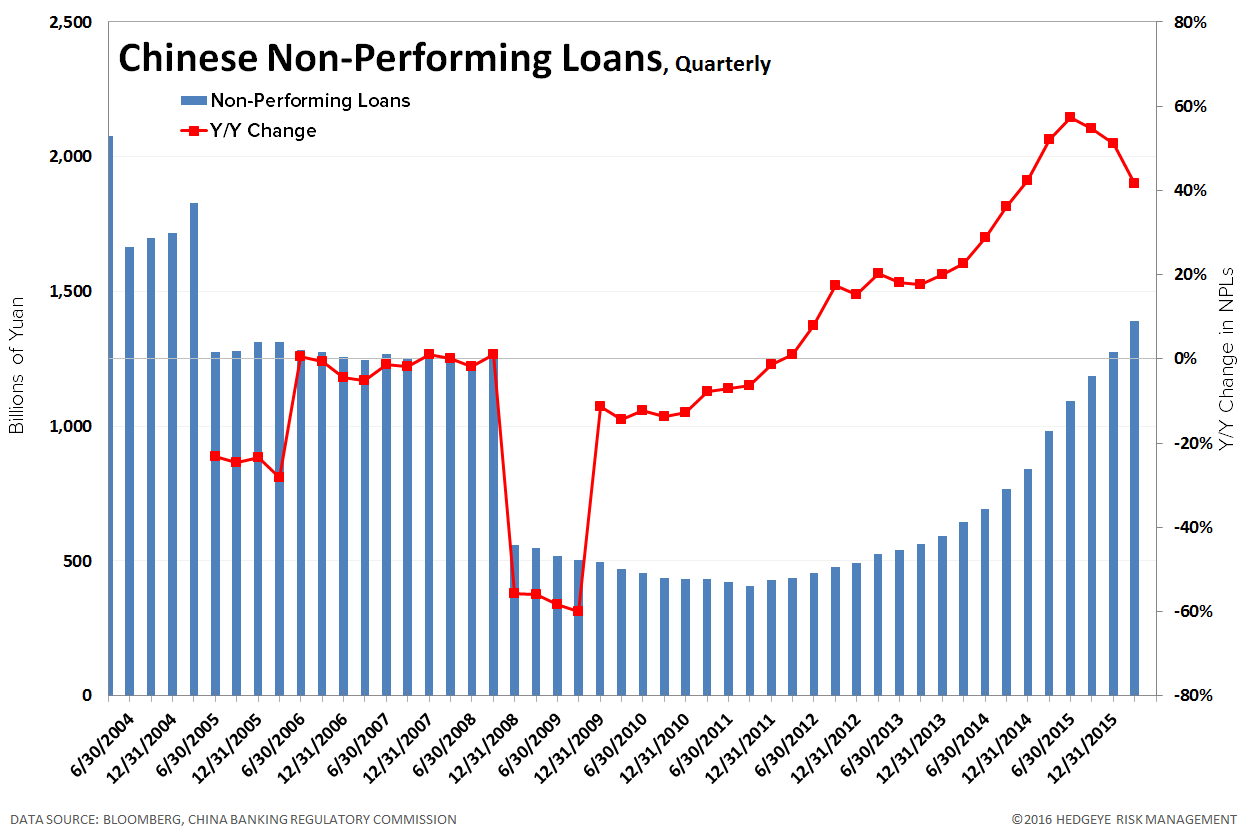
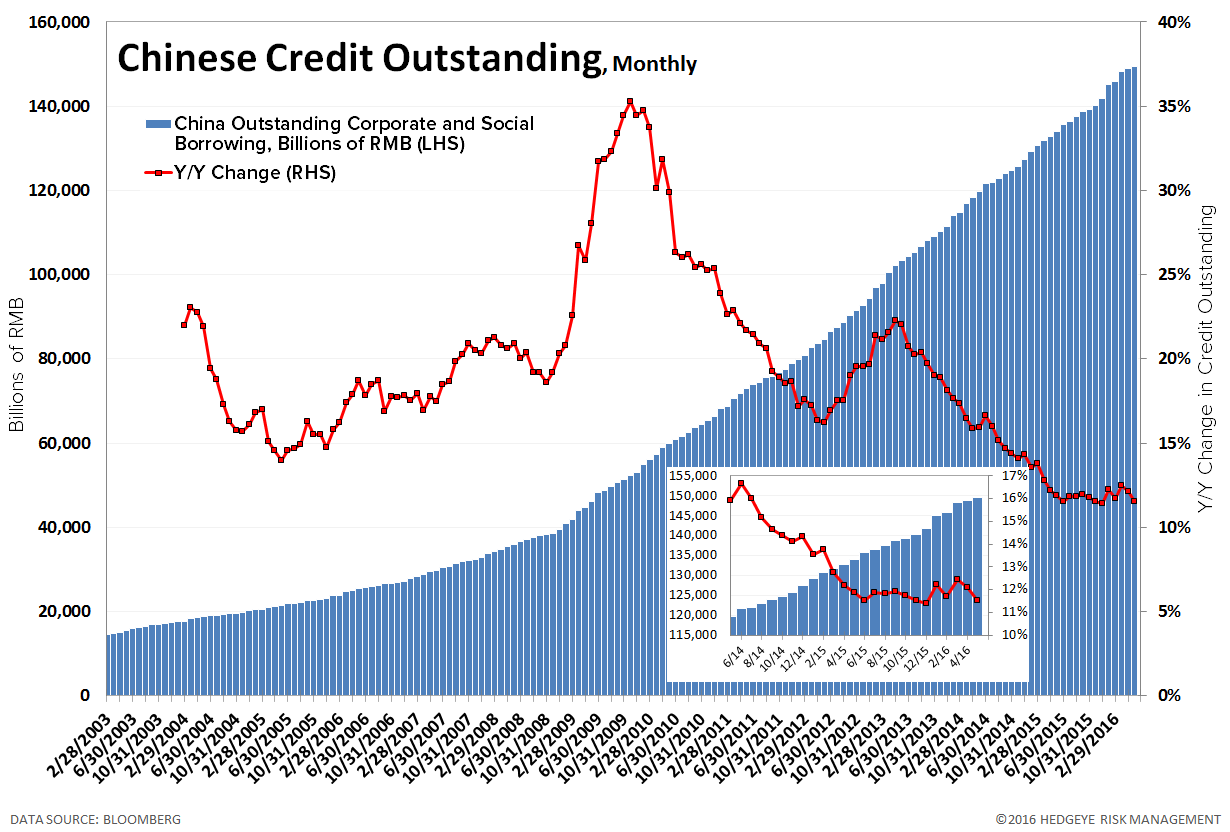
13. Chinese Non-Performing Loans – Chinese non-performing loans amount to 1,392 billion Yuan as of March 31, 2016, which is up +41.7% year over year. Given the growing focus on China's debt growth and the potential fallout, we've decided to begin tracking loan quality. Note: this data is only updated quarterly.
14. Chinese Credit Outstanding – Chinese credit outstanding amounts to 149.5 trillion RMB as of May 31, 2016 (data released 6/15/2016), which is up +15.5 trillion RMB or +11.5% year over year. Month-over-month, credit is up +553 billion RMB or +0.4%. Note: this data is only updated monthly.
15. 2-10 Spread – Last week the 2-10 spread widened to 93 bps, 2 bps wider than a week ago. We track the 2-10 spread as an indicator of bank margin pressure.

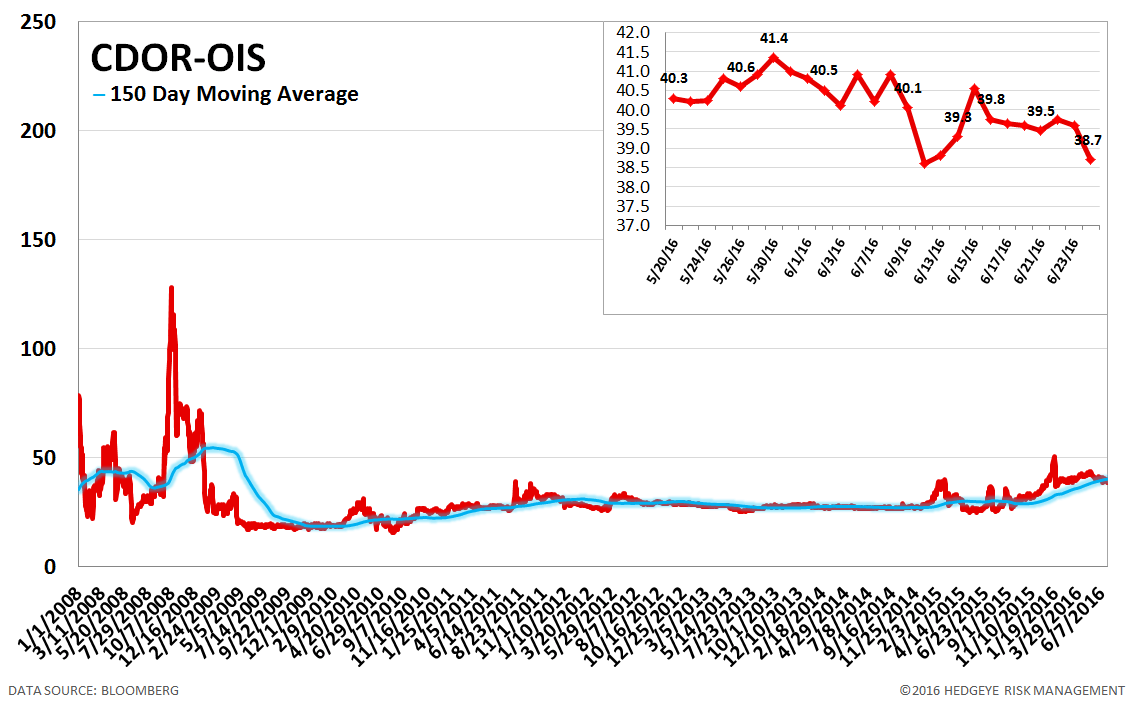
16. CDOR-OIS Spread – The CDOR-OIS spread is the Canadian equivalent of the Euribor-OIS spread. It is the difference between the Canadian interbank lending rate and overnight indexed swaps, and it measures bank counterparty risk in Canada. The CDOR-OIS spread tightened by 1 bps to 39 bps.
Joshua Steiner, CFA
Jonathan Casteleyn, CFA, CMT
Patrick Staudt, CFA
