

Key Takeaway:
Although markets are reacting positively this morning to a poll showing the UK is more likely to stay in the EU, fear prevailed last week, and risk measures flashed mostly red. The overall takeaway is that the upcoming Brexit vote on Thursday is creating volatility on both sides of the dial. CDS widened globally last week, even in the US where the resilience of recent weeks gave way and the median bank swap widened by 10 bps to 99. Additionally, the high yield YTM jumped by 15 bps to 7.26%, and the CDOR-OIS spread, a measure of counterparty risk in Canada, widened by 1 bps to 40.
Risk measures in our heat map below are mostly negative across all durations.
Current Ideas: 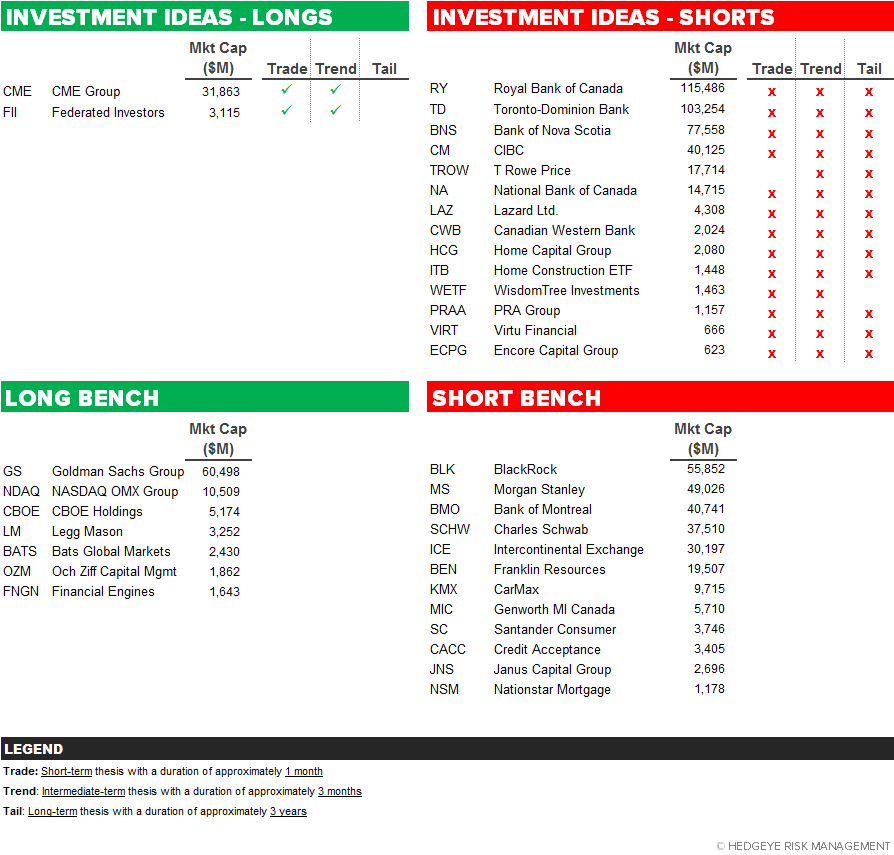
Financial Risk Monitor Summary
• Short-term(WoW): Negative / 2 of 13 improved / 6 out of 13 worsened / 5 of 13 unchanged
• Intermediate-term(WoW): Negative / 1 of 13 improved / 7 out of 13 worsened / 5 of 13 unchanged
• Long-term(WoW): Negative / 2 of 13 improved / 3 out of 13 worsened / 8 of 13 unchanged

1. U.S. Financial CDS – With investors worrying about the domestic implications of a Brexit, all domestic financials swaps widened last week. Moneycenters were most heavily affected, widening by an average 10 bps.
Widened the least WoW: AON, GNW, ALL
Widened the most WoW: MS, GS, C
Widened the least WoW: AON, RDN, SLM
Widened the most MoM: MS, GS, WFC

2. European Financial CDS – With Thursday's Brexit vote approaching, Financials swaps mostly widened in Europe last week. The median CDS widened by 9 bps to 131.

3. Asian Financial CDS – Chinese bank swaps all widened, in part due to MSCI deferring the addition of China's A shares to the EM Index. That deferral delays an expected capital inflow to the country of tens of billions of dollars. In India, 2 of 3 financials swaps widened.

4. Sovereign CDS – Sovereign swaps mostly widened over last week. Portuguese swaps stood out, widening by 33 bps to 316.


5. Emerging Market Sovereign CDS – Emerging market swaps mostly widened last week. Russian sovereign swaps widened the most, by 15 bps to 264. Meanwhile, with Rio de Janeiro declaring a state of financial disaster so that it can more easily manage the government's scant resources, Brazilian swaps tightened by -2 bps to 341.

6. High Yield (YTM) Monitor – High Yield rates rose 15 bps last week, ending the week at 7.26% versus 7.11% the prior week.

7. Leveraged Loan Index Monitor – The Leveraged Loan Index fell 9.0 points last week, ending at 1901.

8. TED Spread Monitor – The TED spread fell 2 bps last week, ending the week at 39 bps this week versus last week’s print of 41 bps.

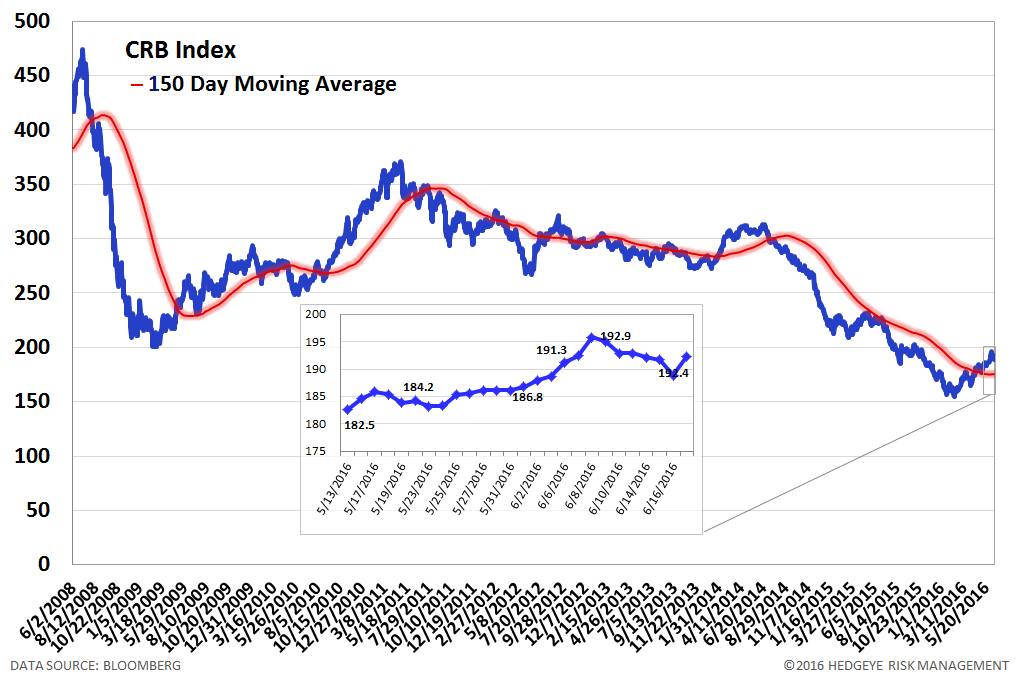
9. CRB Commodity Price Index – The CRB index fell -1.8%, ending the week at 192 versus 196 the prior week. As compared with the prior month, commodity prices have increased 4.4%. We generally regard changes in commodity prices on the margin as having meaningful consumption implications.
10. Euribor-OIS Spread – The Euribor-OIS spread (the difference between the euro interbank lending rate and overnight indexed swaps) measures bank counterparty risk in the Eurozone. The OIS is analogous to the effective Fed Funds rate in the United States. Banks lending at the OIS do not swap principal, so counterparty risk in the OIS is minimal. By contrast, the Euribor rate is the rate offered for unsecured interbank lending. Thus, the spread between the two isolates counterparty risk. The Euribor-OIS spread was unchanged at 9 bps.

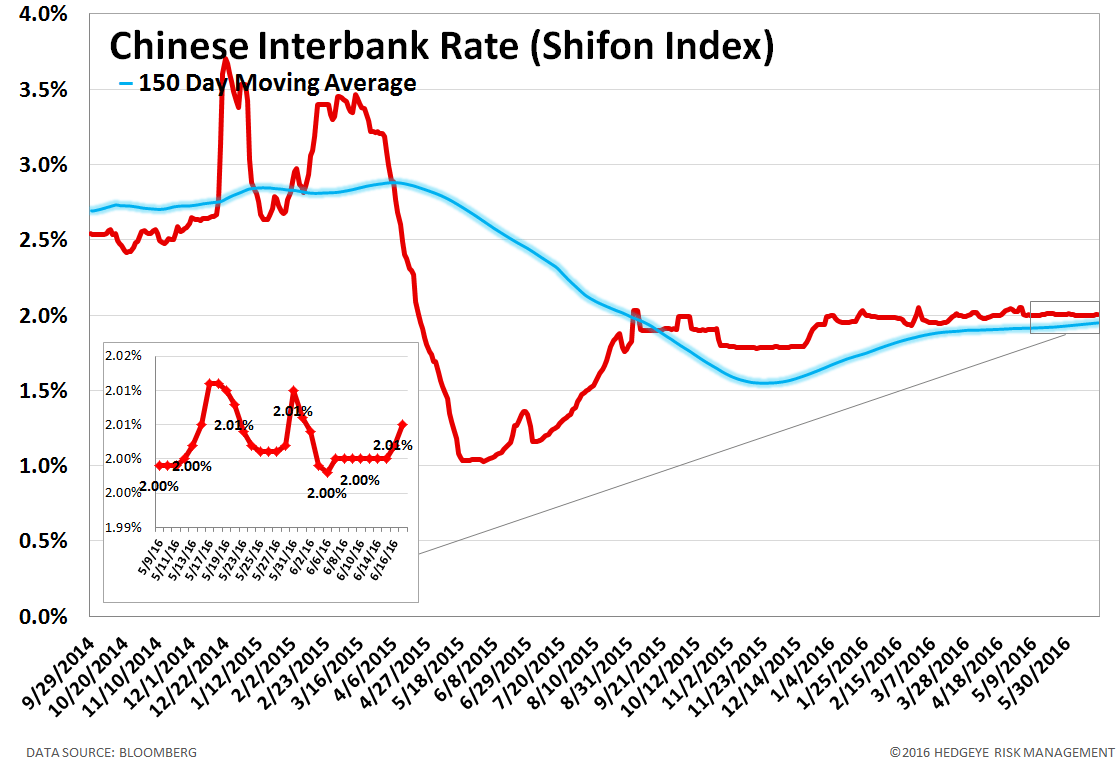
11. Chinese Interbank Rate (Shifon Index) – The Shifon Index rose 1 basis point last week, ending the week at 2.01% versus last week’s print of 2.00%. The Shifon Index measures banks’ overnight lending rates to one another, a gauge of systemic stress in the Chinese banking system.
12. Chinese Steel – Steel prices in China rose 0.1% last week, or 3 yuan/ton, to 2339 yuan/ton. We use Chinese steel rebar prices to gauge Chinese construction activity and, by extension, the health of the Chinese economy.

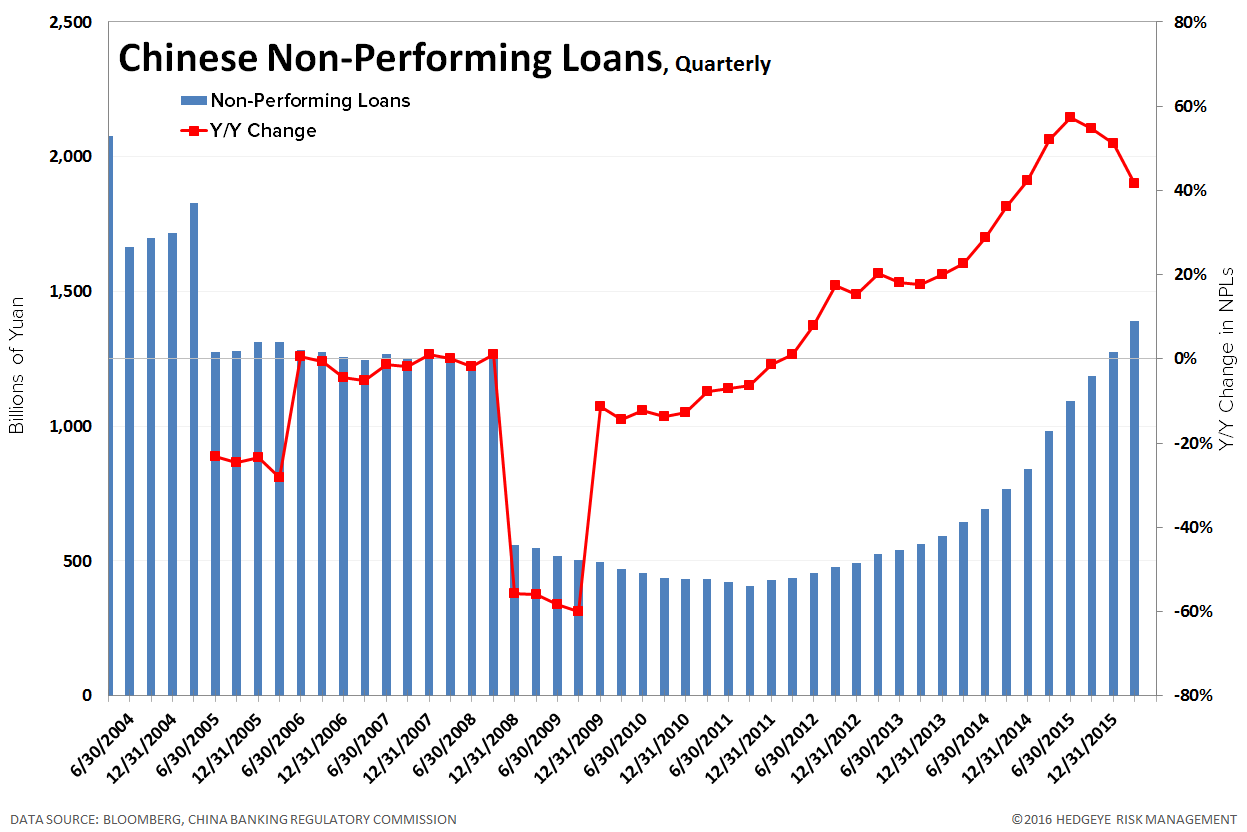
13. Chinese Non-Performing Loans – Chinese non-performing loans amount to 1,392 billion Yuan as of March 31, 2016, which is up +41.7% year over year. Given the growing focus on China's debt growth and the potential fallout, we've decided to begin tracking loan quality. Note: this data is only updated quarterly.
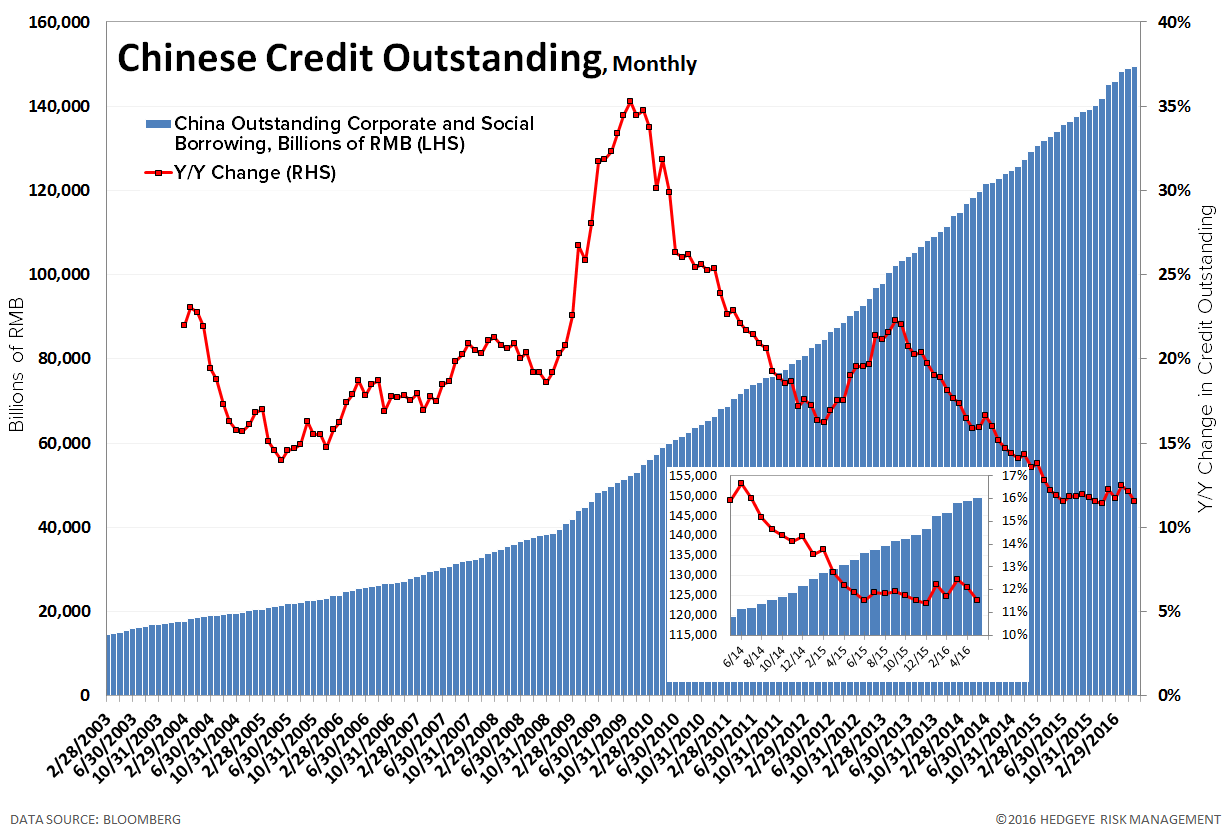
14. Chinese Credit Outstanding – Chinese credit outstanding amounts to 149.5 trillion RMB as of May 31, 2016 (data released 6/15/2016), which is up +15.5 trillion RMB or +11.5% year over year. Month-over-month, credit is up +553 billion RMB or +0.4%. Note: this data is only updated monthly.
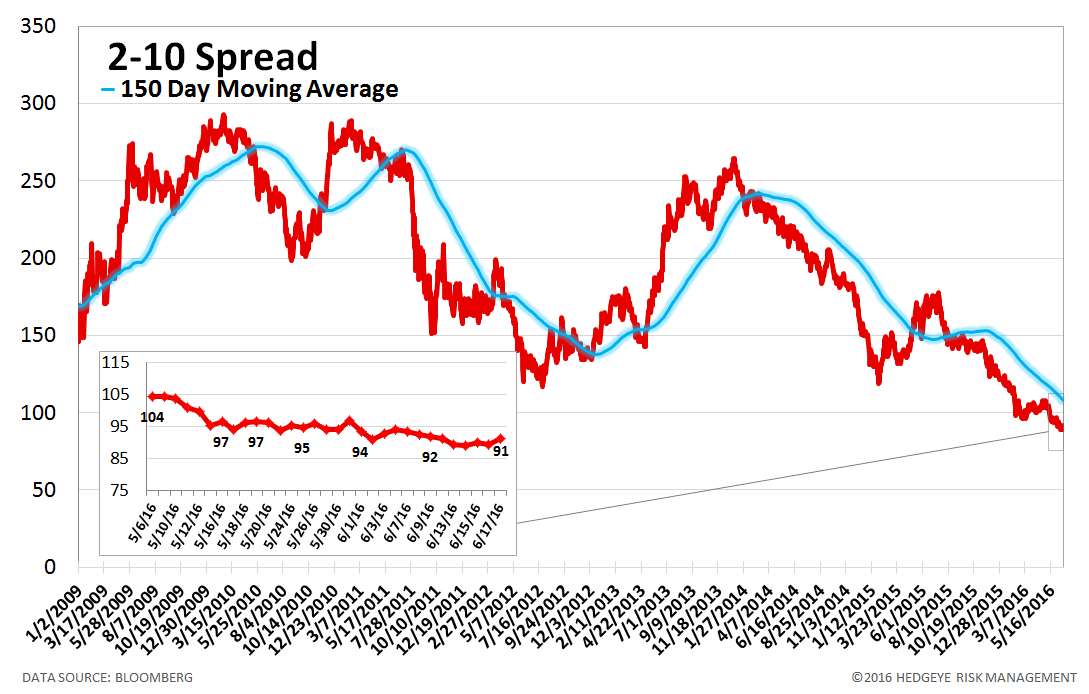
15. 2-10 Spread – Last week the 2-10 spread was unchanged last week at 91 bps. We track the 2-10 spread as an indicator of bank margin pressure.
16. CDOR-OIS Spread – The CDOR-OIS spread is the Canadian equivalent of the Euribor-OIS spread. It is the difference between the Canadian interbank lending rate and overnight indexed swaps, and it measures bank counterparty risk in Canada. The CDOR-OIS spread widened by 1 bps to 40 bps.

Joshua Steiner, CFA
Jonathan Casteleyn, CFA, CMT
Patrick Staudt, CFA
