
Key Takeaway:
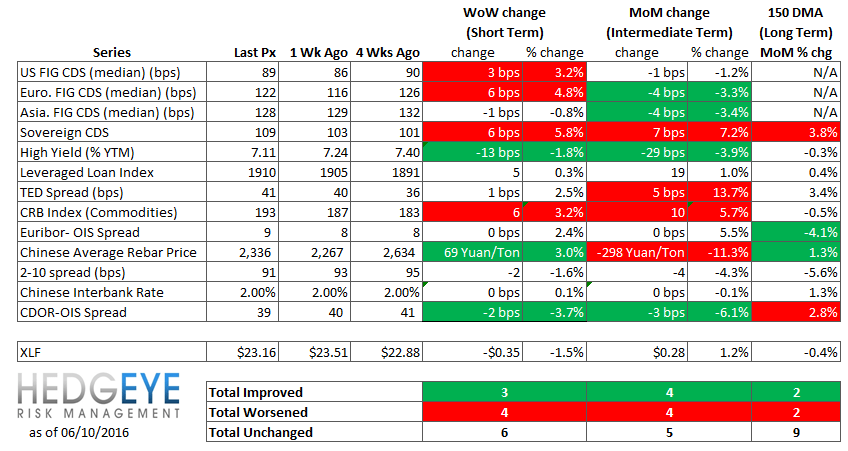
Mixed risk measures highlight the contention and uncertainty in the market as the June 23 Brexit vote approaches and investors look to the FOMC announcement in the wake of poor U.S. labor data; risk measures on the intermediate and longer term are equally negative and positive, and short-term measures are only slightly more negative. In particular, U.S. financials, European financials, and Sovereign CDS all widened significantly last week while the high yield YTM fell by -13 bps to 7.11% and the price of Chinese steel rose for the first week in seven, by +3.0% to 2,336.
Current Ideas:

Financial Risk Monitor Summary
• Short-term(WoW): Negative / 3 of 13 improved / 4 out of 13 worsened / 6 of 13 unchanged
• Intermediate-term(WoW): Negative / 4 of 13 improved / 4 out of 13 worsened / 5 of 13 unchanged
• Long-term(WoW): Negative / 2 of 13 improved / 2 out of 13 worsened / 9 of 13 unchanged
1. U.S. Financial CDS – Swaps widened for 12 out of 13 domestic financial institutions as markets continued to react to developing weakness in U.S. labor data.
Widened the least/ tightened the most WoW: COF, ALL, SLM
Widened the most WoW: WFC, MET, PRU
Tightened the most WoW: AIG, HIG, LNC
Widened the most MoM: TRV, AGO, XL

2. European Financial CDS – Financials swaps mostly widened in Europe last week as the June 23 Brexit vote approaches. Conversely, Greek bank swaps stood out, tightening between -53 and -190 bps.

3. Asian Financial CDS – Bank CDS were mixed in Asia last week. The median CDS tightened by -1 bps to 128.

4. Sovereign CDS – Sovereign swaps mostly widened over last week. Italy and Portugal led the move, widening by 11 bps and 12 bps to 141 and 283 respectively.


5. Emerging Market Sovereign CDS – Emerging market swaps were mixed last week, and the median was unchanged at 180.

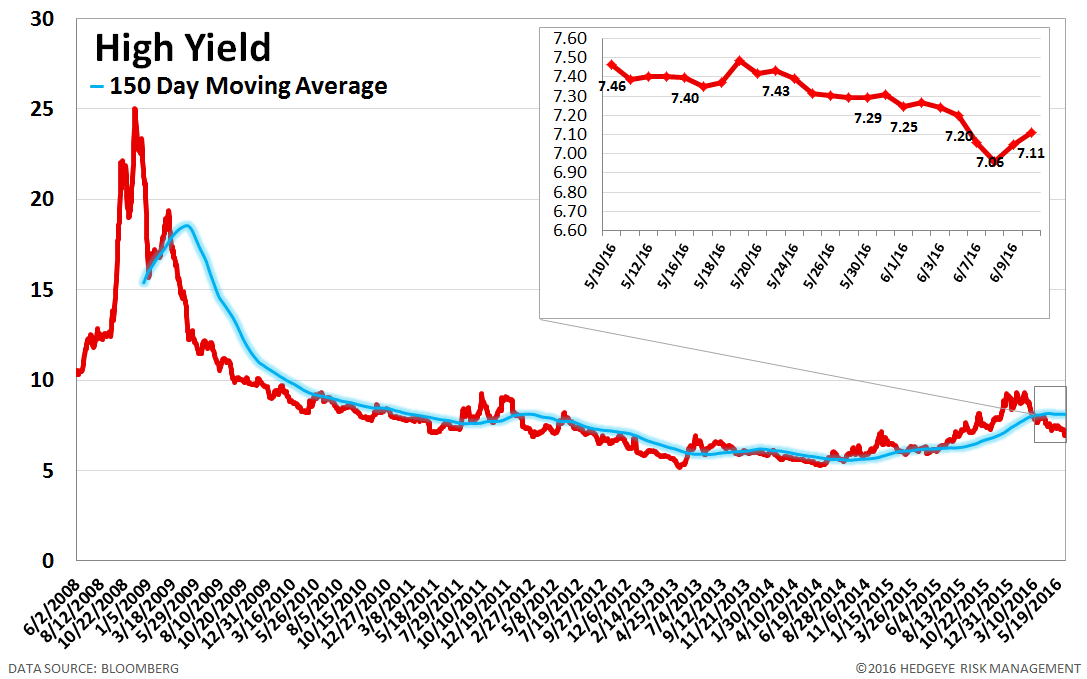
6. High Yield (YTM) Monitor – High Yield rates fell 13 bps last week, ending the week at 7.11% versus 7.24% the prior week.
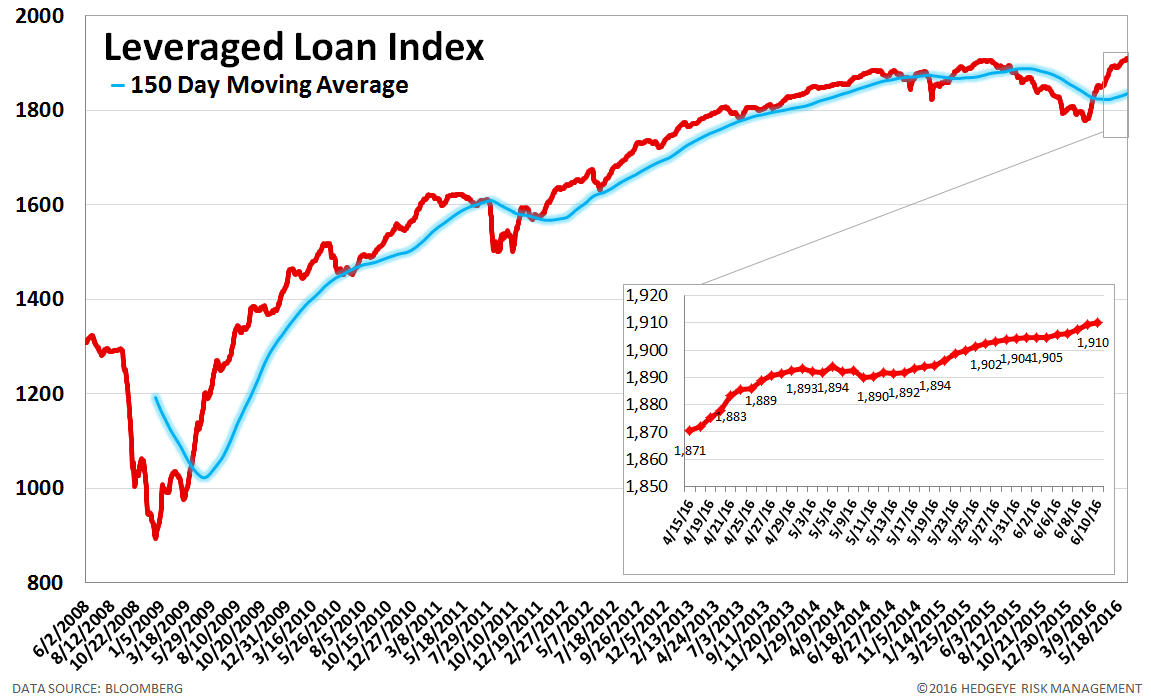
7. Leveraged Loan Index Monitor – The Leveraged Loan Index rose 5.0 points last week, ending at 1910.
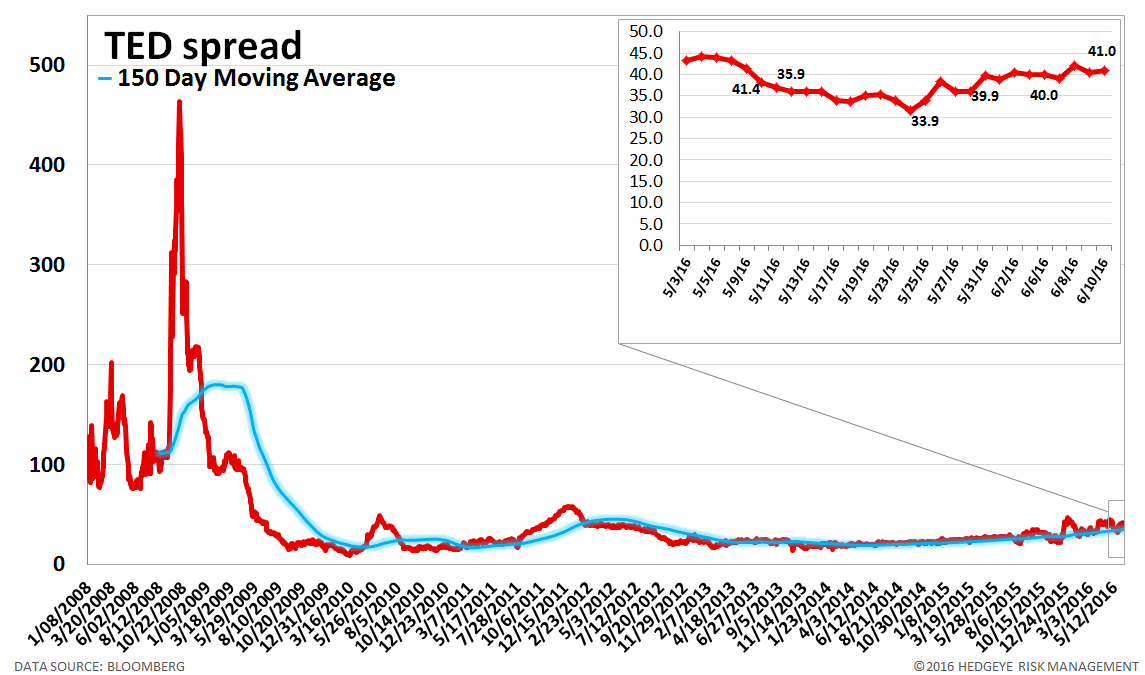
8. TED Spread Monitor – The TED spread rose 1 basis point last week, ending the week at 41 bps this week versus last week’s print of 40 bps.
9. CRB Commodity Price Index – The CRB index rose 3.2%, ending the week at 193 versus 187 the prior week. As compared with the prior month, commodity prices have increased 5.7%. We generally regard changes in commodity prices on the margin as having meaningful consumption implications.

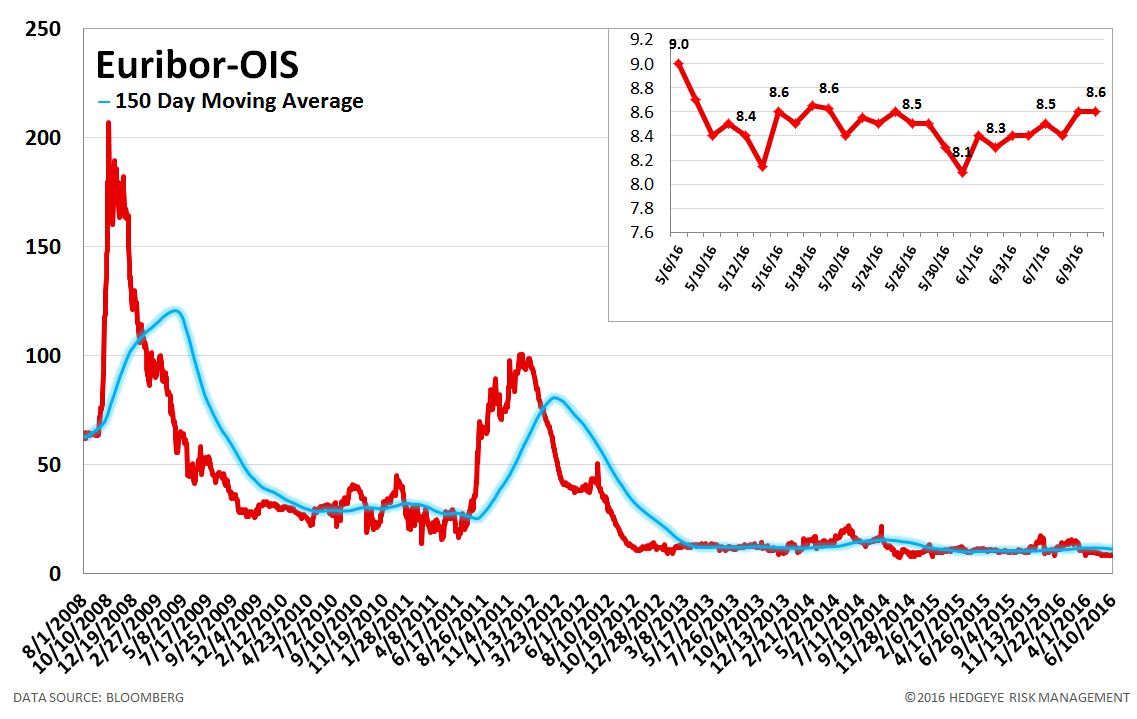
10. Euribor-OIS Spread – The Euribor-OIS spread (the difference between the euro interbank lending rate and overnight indexed swaps) measures bank counterparty risk in the Eurozone. The OIS is analogous to the effective Fed Funds rate in the United States. Banks lending at the OIS do not swap principal, so counterparty risk in the OIS is minimal. By contrast, the Euribor rate is the rate offered for unsecured interbank lending. Thus, the spread between the two isolates counterparty risk. The Euribor-OIS spread was unchanged at 9 bps.
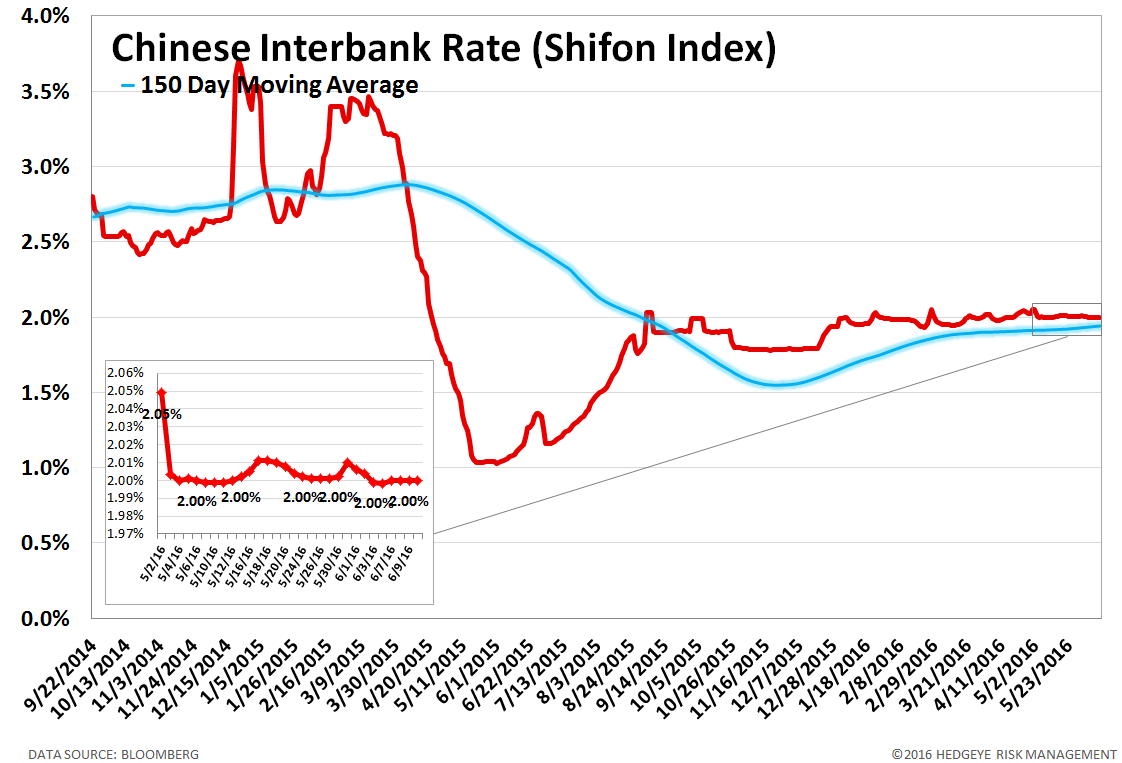
11. Chinese Interbank Rate (Shifon Index) – The Shifon Index was unchanged last week at 2.00%. The Shifon Index measures banks’ overnight lending rates to one another, a gauge of systemic stress in the Chinese banking system.
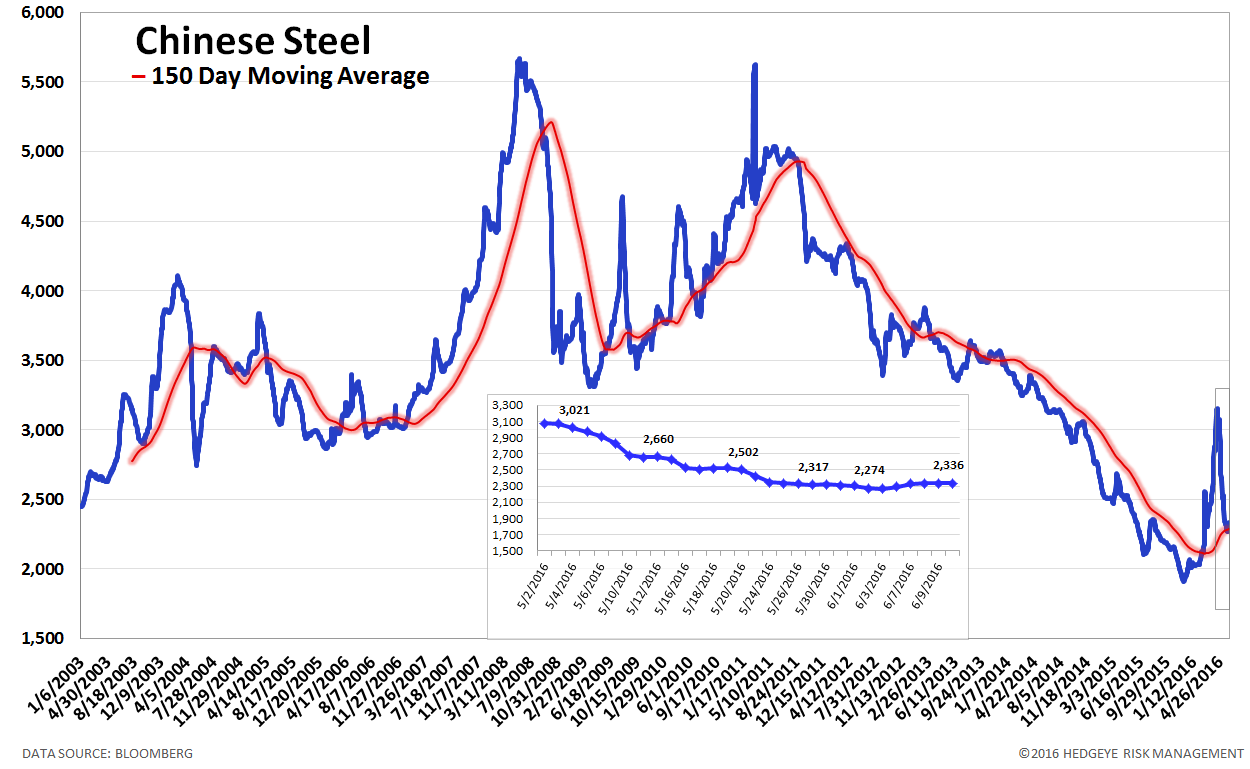
12. Chinese Steel – Steel prices in China rose 3.0% last week, or 69 yuan/ton, to 2336 yuan/ton. We use Chinese steel rebar prices to gauge Chinese construction activity and, by extension, the health of the Chinese economy.
13. Chinese Non-Performing Loans – Chinese non-performing loans amount to 1,392 billion Yuan as of March 31, 2016, which is up +41.7% year over year. Given the growing focus on China's debt growth and the potential fallout, we've decided to begin tracking loan quality. Note: this data is only updated quarterly.

14. Chinese Credit Outstanding – Chinese credit outstanding amounts to 148.7 trillion RMB as of April 30, 2016 (data released 5/13/2016), which is up +15.8 trillion RMB or +11.9% year over year. Month-over-month, credit is up +656 billion RMB or +0.4%. Note: this data is only updated monthly.

15. 2-10 Spread – Last week the 2-10 spread tightened to 91 bps, -2 bps tighter than a week ago. We track the 2-10 spread as an indicator of bank margin pressure.

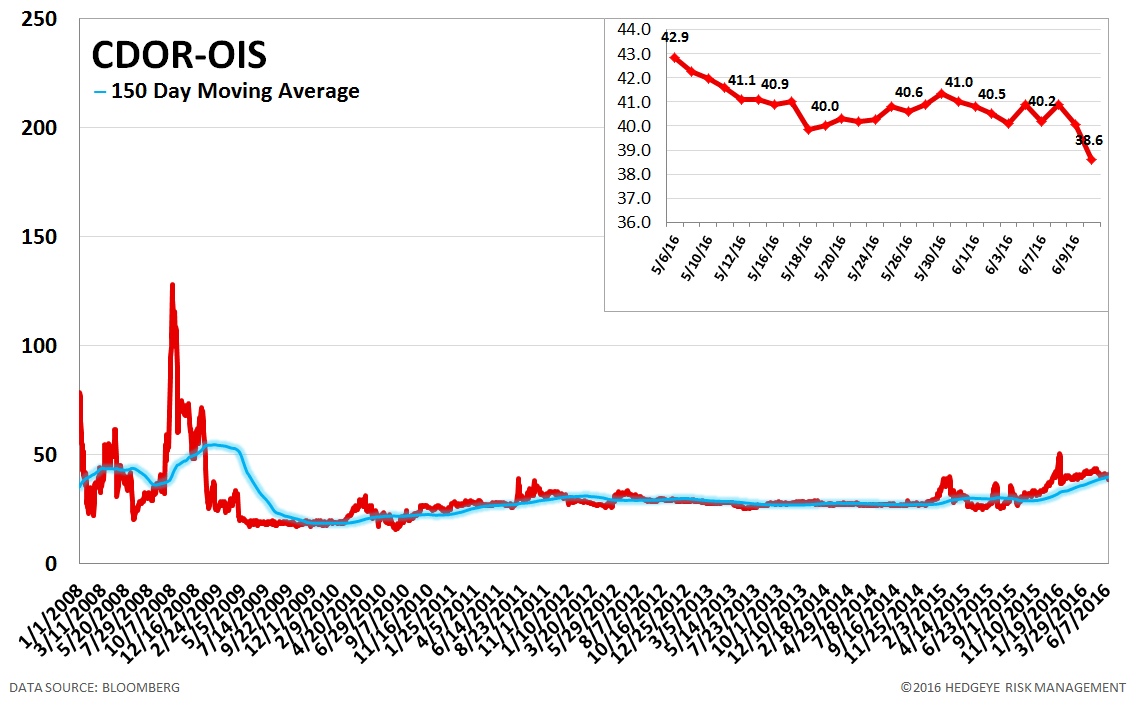
16. CDOR-OIS Spread – The CDOR-OIS spread is the Canadian equivalent of the Euribor-OIS spread. It is the difference between the Canadian interbank lending rate and overnight indexed swaps, and it measures bank counterparty risk in Canada. The CDOR-OIS spread tightened by 2 bps to 39 bps.
Joshua Steiner, CFA
Jonathan Casteleyn, CFA, CMT