

Our Hedgeye Housing Compendium table (below) aspires to present the state of the housing market in a visually-friendly format that takes about 30 seconds to consume.

Today’s Focus: April Pending Home Sales
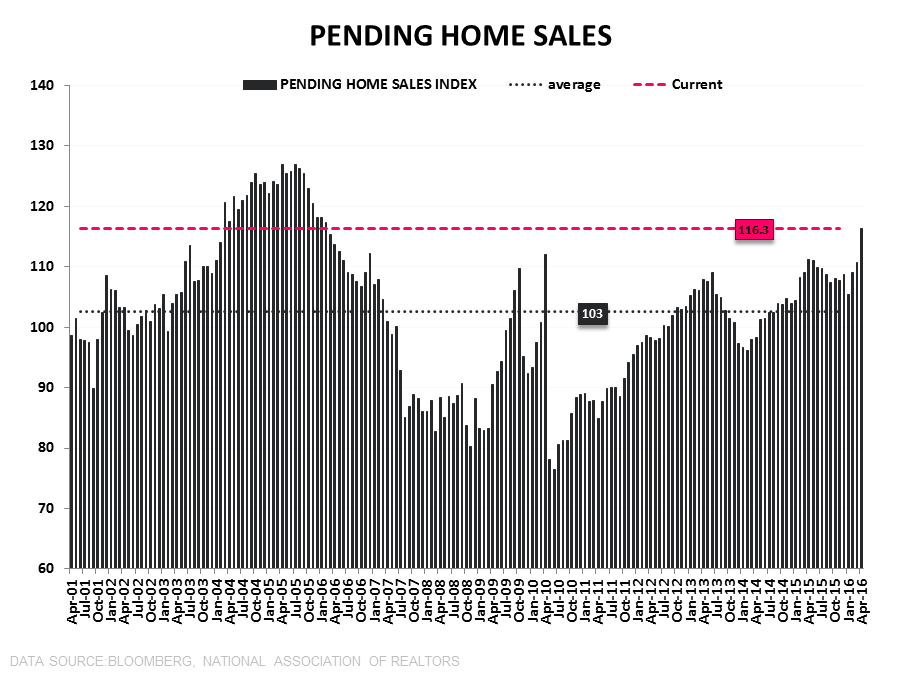
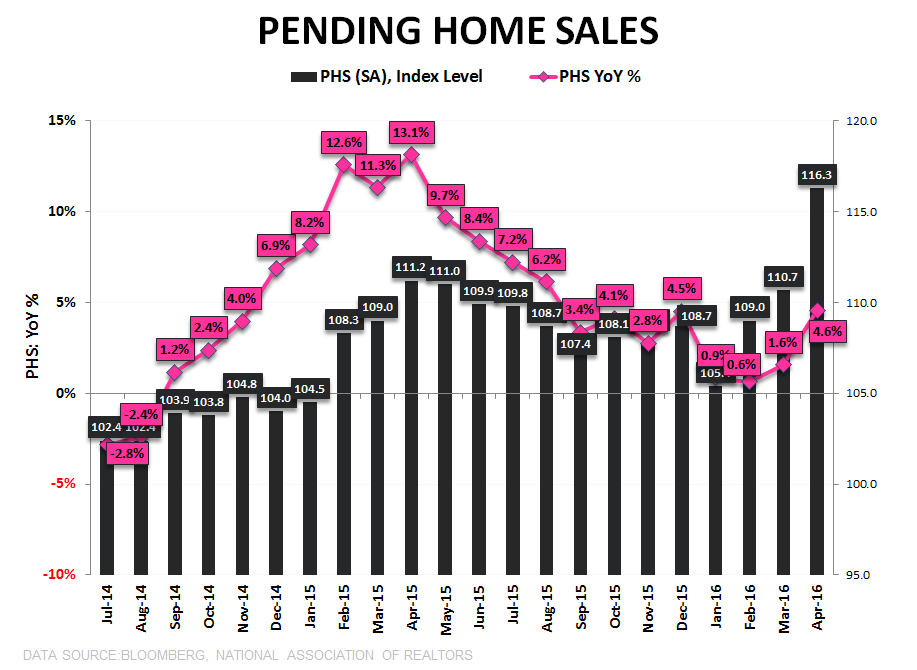
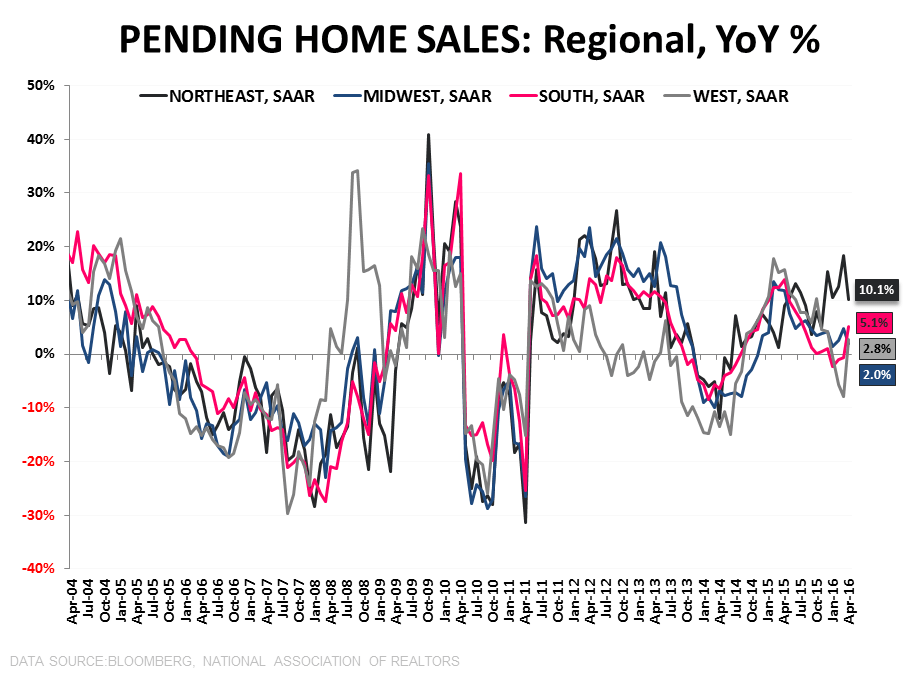
Pending Home Sales posted its largest sequential increase in 5 ½ years in April, taking the Index to a new 10Y high. On a seasonally adjusted basis, year-over-year growth accelerated to +4.6% YoY from ~+0% over the last 3 months. In contrast, year-over-year growth on a NSA basis decelerated for a 2nd consecutive month to +2.9% YoY. Regionally, the +6.8% rise in the South and the +10.1% increase in the West drove the sequential strength while the 10.1% YoY gain in the Northeast supported the YoY acceleration.
Frankly, we were surprised by the magnitude of strength in the April data as we were looking for something in the -2% to +2% range. The key question out of the print is whether we have, in fact, rebased to a higher level of activity or whether April represents an outlier. The preponderance of domestic macro, where stall speed remains the predominant trend, suggests the latter while the similarly strong (albeit distorted) NHS report on Tuesday hints at the former. For sure, rates remain low, labor trends decent and the longer-term opportunity for housing compelling but that’s been broadly true for most of the last four years and why that confluence of factors would suddenly manifest in multi-year/multi-decade high growth rates precisely in April isn’t obvious.
A few other quick considerations:
- Mean Reversion: Mean reversion in Pending Sales has already occurred and at 116 on the index we are now +13.5% above the long-term average with further upside seemingly constrained. The primary caveat is that the “long-term” only extends back to 2000 and the advent of the PHS series (see 1st chart below). The 2nd chart below – which shows single family existing home sales adjusted for population growth - offers some longer cycle context. With sales at 4.78MM units as of the latest month we sit +3.3% above the long-term average with 24% upside to average peak levels and -34% downside to average cycle trough levels. Note that sales are population adjusted and the average peak calculation excludes the bubble peak in 2005/06.
- Good = Bad: To the extent strong Housing data drives policy action out of the Fed the feedback loop is a negative one as housing related equities are marked underperformers during tightening cycles.
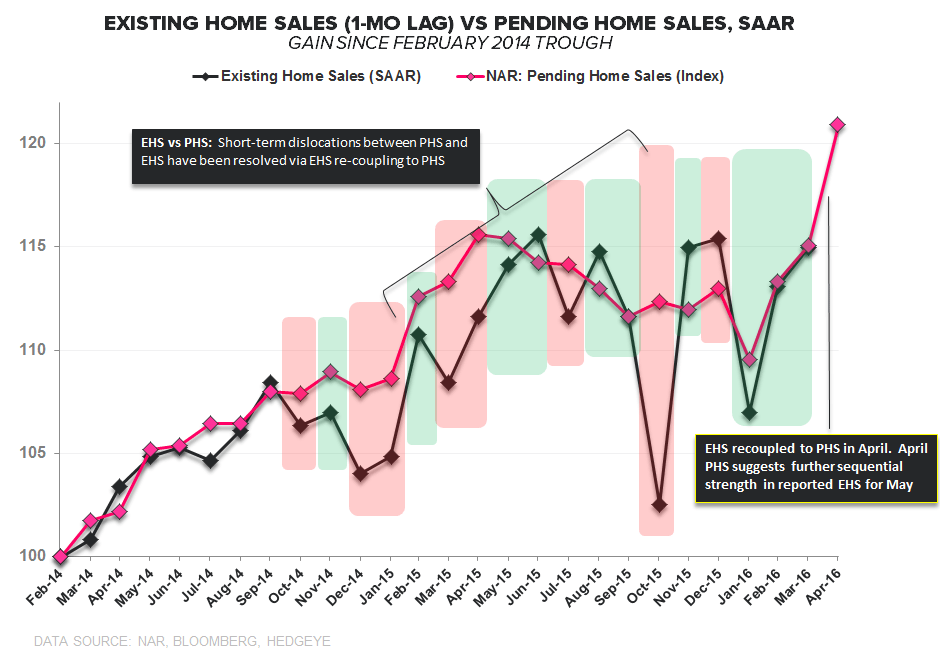
- EHS: The gain in PHS in April augurs sequential strength for EHS in May. A full recoupling between the two series implies +5.1% upside in EHS to 5.71 MM units. We'll get May EHS on 6/22.


About Pending Home Sales:
The Pending Home Sales Index is a monthly data release from the National Association of Realtors (NAR) and is considered a leading indicator for housing activity in the US. It is a leading indicator for Existing Home Sales, not New Home Sales. A pending home sale reflects the signing of a contract, but not the closing of the transaction, which occurs 1-2 months later. The NAR uses data from the MLS and large brokers to calculate the Pending Home Sales index. An index value of 100 corresponds to the average level of activity during 2001.
Frequency:
The NAR Pending Home Sales index is released between the 25th and the 31st of each month and covers data from the prior month.
Joshua Steiner, CFA
Christian B. Drake
