“He’s been dying from the same heart attack for the last 20 years… he thinks he’s going to live forever.”
-Michael Corleone on rival Hyman Roth, The Godfather
Yesterday’s Markit PMI for May printed 50.8 – dropping -1.6 pts sequentially (to 50.8, marking the 2nd lowest reading of the current downcycle) and to a level consistent with 128K in payroll adds for the month.
PMI activity has been experiencing the same “bottom” for the last 20 months … the expansion is going to last forever.

Back to the Global Macro Grind...
To be fair, 50 represents the expansion-contraction Mendoza line in diffusion indices like the PMI’s, so 50.8 still represents expansion, but only barely.
Economies are path dependent, so initial conditions matter and flirting with 50 with a faux hawkish Fed and no fundamental catalyst for a 50 => 54 => 60 type progression is not a position of strength.
This is the part of the missive where the conventional strategist playbook calls for narrative strong-arming with sophisticated sounding analytics and technical jargon to raise the perceived scarcity value.
I’m smart. Not like everybody says ... like dumb … I’m smart and I want respect! – Fredo
I’ll get to contextualizing the recent and upcoming domestic macro data, but first some Common Sense mongering.
This isn’t the kind of sophistication that gets you paid "2 and 20" but it is a bit of sleep-well-at-night sensibility that probably makes you 2 while others are losing 20.
The layman’s, passive strategy frame-up goes something like this:
We are 7 years and +200% into the current expansion. That is not a surprise, the Reinhart & Rogoff facts are well circulated.
Balance Sheet recessions are characterized by a protracted slump in employment, consumption, and credit growth. And expansions following financial crises are typically longer in period and lower in amplitude with the average & median time to reach pre-crisis levels of income being 8 and 6.5 years, respectively.
Real per capita income in the U.S. reached pre-crisis levels at the beginning of 2014, so just about 6 years from the onset of the recession.
So, even with unprecedented intervention and global policy coordination we still fell basically right on the average. This time, in fact, was not particularly different.
Now, 2.5 years out from reaching income break-even, this is where we are:
- At 85 months, the current expansion is late relative to any historical reference (the mean & median over the last century are 59-months and 50-months, respectively).
- Global and domestic growth are slow and/or slowing and slower for longer will remain the prevailing reality given global leverage and demographic dynamics
- The central banking #BeliefSystem has begun breaking down alongside discretely diminishing returns to monetary policy initiatives.
- China increased credit by $1T in 1Q16 (as in (Dr. Evil Face) 1 Trillion Dollars). Perhaps – alongside a rhetorically dovish Fed - that helped quell the commodity contagion but that debt bender got them … another lower low in GDP.
- Employment Growth, Consumption Growth, Income Growth, Confidence and Corporate Profitability are all past peak and SPX sales and earnings growth have been negative for each of the last 6 quarters.
Does passing those simple realities through your common-sense-filter suggest you should be ramping your high-beta, cyclical exposure or risk-managing the same defensive and style factor exposures that have been working for the last year?
To frame it up slightly differently:
So Nice, It’s Like I Hit My (late-cycle) Prime Twice: Let’s suppose the expansion lasts two more years and base effects help drive negative sales and earnings growth nominally positive. How much runway does that give in terms of price reflation in underperforming cyclicals before a re-rotation back into more defensive, late-cycling positioning. 3, 6, 9-months?
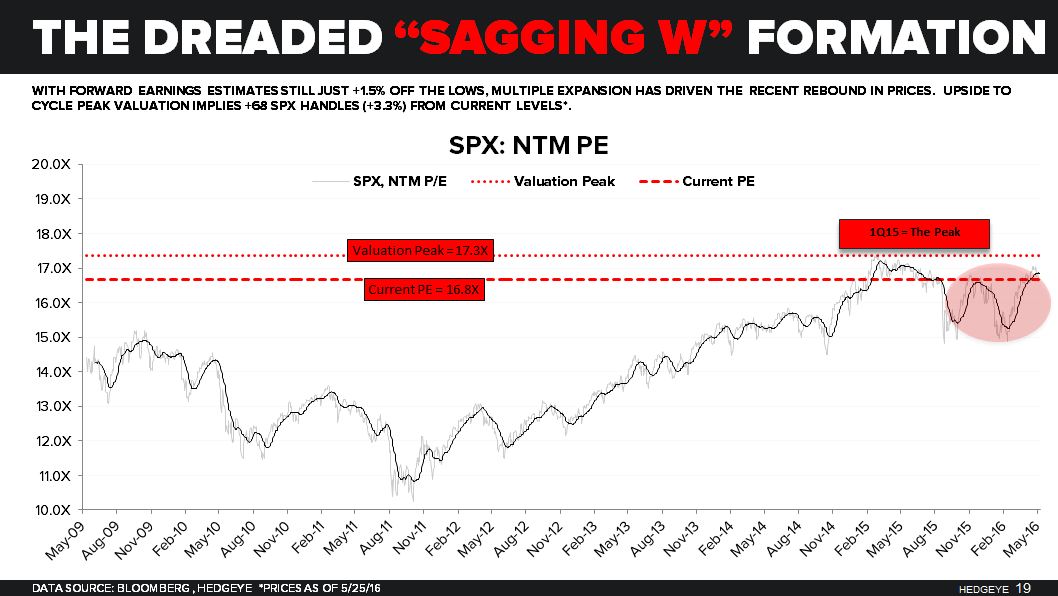
Valuation is Not A Catalyst: Valuation isn’t an anchor in our decision making process over shorter-to-medium-term durations but it is a prime factor for others so the influence on prices can’t be dismissed outright. With SPX forward earnings estimates up just +1.5% off the lows, multiple expansion has driven most of the rebound in prices off the February lows. Upside to cycle peak valuation (recorded in 1H15) implies +68 SPX handles or +≈3.3% from current levels. In other words, unless the thesis is for accelerating earnings, that’s the upside you’re playing for under an assumption for a return to peak multiples.
To quickly round out the rest of domestic Macro:
Housing: Headline New Home Sales in April were strong, rising +16.6% sequentially and marking the fastest pace of MoM growth since January of 1992. In our note to clients on Monday we highlighted two cautionary points:
- The Headline was distorted by a seemingly outlier increase in sales in the Northeast. Sales in the Northeast were up +52.7% MoM and a remarkable +323% YoY, driving roughly 40% of the reported increase in total sales.
- NHS are the most volatile and highly revised housing data series there is and we don’t take an overly convicted view of any single month in isolation – regardless if the data are good or bad. The imprecision is captured explicitly in the standard error of the estimate - for example, the +23.8% YoY increase recorded in April carries a 23% margin of error. In other words, if we were to anchor on a single series in shaping our high frequency view on housing, NHS would be the last series we’d use.
Pending Home Sales: We’ll get Pending Home Sales data for April this morning which represent signed contract activity in the 90% of the Housing Market that is existing sales. PHS have been decelerating for the last 11 months and face peak comps in April & May. For context, sales need to be up +0.6% sequentially just for year-over-year growth to be 0%. As we highlighted last week, -2%-to-+2% is your fundamental demand backdrop in the existing market for the next quarter+.
1Q GDP: The final Construction Spending, Trade Balance and Factory Order data for March – all of which saw positive revisions - will support a upward revision to 1Q GDP tomorrow morning. Consensus at 0.9% (up from +0.5%) is about right.
Income & Spending | Sequential ↑, Trend ↓: We’ll get the official income and spending data for April on Tuesday. The sum of aggregate hours and hourly earnings growth from the NFP report implies a modest sequential acceleration in aggregate income growth. The savings rate will remain the swing factor but if it’s flat with last April at 5.1% - and in combination with the acceleration in revolving credit growth - then it’s likely we get a modest sequential acceleration in consumption growth. That sequential improvement will come inside a larger trend of deceleration that will remain ongoing.
So, that’s both the passive macro strategy playbook and the short-term fundamental setup.
We plan to both tactically trade the immediate-term risk range while staying strategically positioned for the late-cycle Trend … but that’s just Hedgeye Cosa Nostra …. no Omerta, just real-time and transparent.
Our immediate-term Global Macro Risk Ranges are now:
UST 10yr Yield 1.69-1.90%
SPX 2031-2096
VIX 13.63-17.58
USD 94.01-95.95
YEN 108.45-110.79
Oil (WTI) 46.99-50.16
Gold 1
To Stand-Up (macro) Guys trying not to fall,
Christian B. Drake
U.S. Macro Analyst