

When Encore Capital Group (ECPG) and PRA Group (PRAA) reported earnings two weeks ago, we highlighted that the former is showing growing signs of the slowdown ahead while the latter is already engulfed in a meltdown.
Those notes can be found here:
ENCORE CAPITAL GROUP (ECPG) | GROWING SIGNS OF THE SLOWDOWN AHEAD
PRA GROUP (PRAA) | THAT ESCALATED QUICKLY
Today, we are providing an in-depth vintage analysis of exactly what is going on under the hood at ECPG and PRAA. At both companies, collections after costs on newer vintages are woefully short of the needed hurdle rates to justify current valuations. At PRA Group, the slowdown is so severe that the company is persistently booking allowance charges to reverse revenue and correct overly zealous collection estimates, driving top line growth into negative territory. Meanwhile, at Encore Capital Group, the decline in newer vintages' ability to cover their costs is even worse than at PRAA. In fact, ECPG's recovery rates are at their lowest levels in history. We see the deterioration at both companies continuing into the future.
ENCORE CAPITAL GROUP
Declining Recovery of Purchase Price
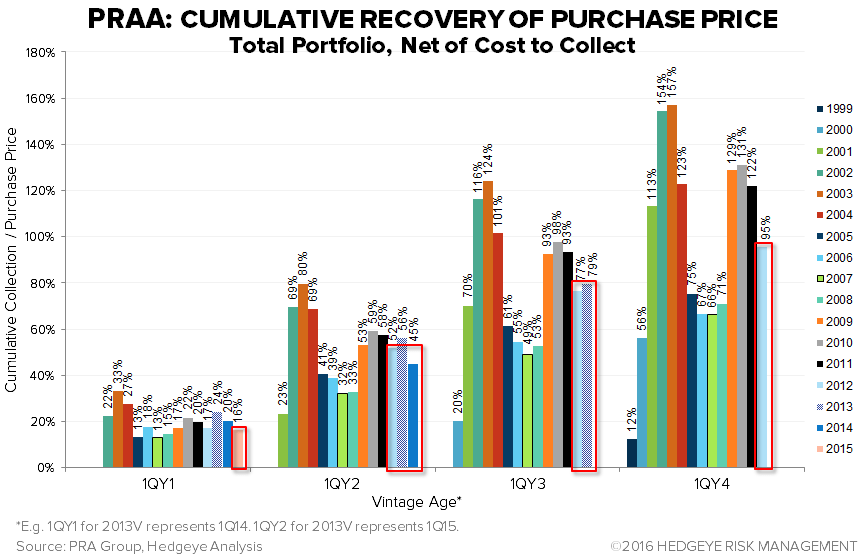
While Encore Capital Group’s management touts that things are going great, our analysis disagrees. Encore’s newer vintages, 2013, 2014, 2015 and 2016 in particular, were more expensive in comparison to collections than those purchased at the optimal point in the credit cycle, namely 2009, 2010, and 2011, and that dynamic is driving down the firm’s collection IRR. The following chart is a vintage comparison of the cumulative collections versus purchase price when each vintage was in the first quarter of its T+1 year, T+2 year, T+3 year, and T+4 year. (For example, Y1Q1 for the 2014 vintage represents all of that vintage's cash collections through 1Q15 versus the reported purchase price for that vintage. Y2Q1 for 2014 represents the vintage's collections through 1Q16.) Our calculations show that 2014 and 2015 are the worst performing vintages on record. The most recent data point for the 2014 vintage in the U.S. and Other Geographies portfolio, Y2Q1, shows that net of cost to collect it has only recovered 53% of its purchase price. That is a significant deterioration from the 77%-78% recovery that the 2009-2011 vintages experienced by the same point in their lives. Additionally, the 2015 vintage’s most up-to-date performance, through Y1Q1, is even worse than the 2014 vintage’s. 2014 had recovered 23% by Y1Q1 while 2015 has recovered only 20%, and both vintages are significantly underperforming the 32%-33% recovery that 2009-2011 vintages experienced by the same point in their lives.
The first two charts below show collections AFTER deducting cost to collect, but do not adjust for interest expense.

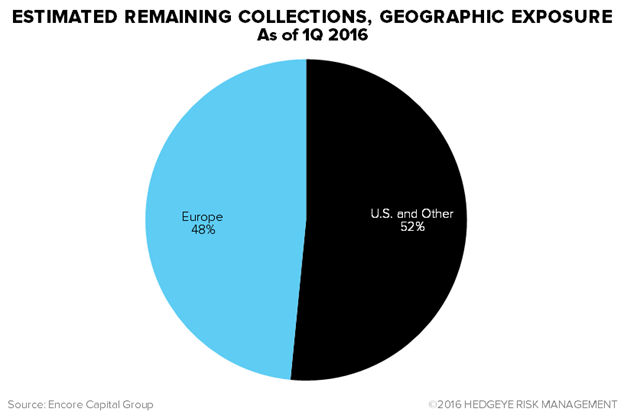
This problem expands beyond the U.S. Encore’s European portfolio, which is 48% of the company’s estimated remaining collections (“ERC”), is showing similar deterioration. Given that the company entered the European market in 2013 with the Cabot acquisition, no pre-2013 comparison is available for Europe. However, the European 2014 vintage is underperforming 2013, and 2015 is doing worse than 2014. At Y2Q1, the 2014 vintage's cumulative cash collections net of cost to collect had only covered 41% of the purchase price versus 2013’s 50%. Additionally, just as in the U.S., the 2015 vintage is even worse than the 2014 vintage. Its most recent reading as of 1Q16 shows that it has recovered only 16% of its purchase price while 2014 had recovered 20% by Y1Q1 and 2013 had recovered 23%.

In addition to the net recovery charts above (collections after costs to collect), we present the following recovery chart which does not deduct cost to collect. This chart goes back beyond the 2009 vintage, before ECPG disclosed cost to collect, to show that 2014 and 2015 are indeed the worst performing vintages in the company’s history.

Translating to Declining Results
This cash collection deterioration of recent vintages is clearly seeping its way into firm-level results. First, post-2012 vintages, which are experiencing lower collections for every dollar of purchase price, are now 90% of Encore’s ERC. In other words, the bulk of the book that Encore is collecting on is now comprised of the worst-performing vintages in the company's history.

The growing share of weak vintages coupled with deteriorating results are finally bleeding into ECPG's firm-level IRR, Y/Y revenue growth, and Y/Y collection growth, all of which have been persistently trending downwards since late 2013~early 2014.


To dive still deeper and show how this decline is affecting operating income on a per-vintage level, the following table takes the revenue that Encore discloses for each vintage and subtracts out its pro forma cost, which is a Hedgeye calculation. The cost figures we use are not actual results reported by Encore, per se, since they don't provide them at the vintage level. However, we apply Encore's overall actual operating expense (excluding CFPB expenses and goodwill imparment) on a pro forma basis to the two major geographies (U.S plus other geographies and Europe) based on their share of the overall "adjusted cost per dollar collected" which Encore does directly report. We then apply the geographic operating expense to each underlying vintage based on share of cash collections within each geography. (Note that the dark blue figures are Hedgeye future estimates.) We believe this is a fair representation.
Our analysis finds a staggering decline in recent vintage profitability. In the U.S., operating income during the year of inception has fallen from $27 million for the 2013 vintage, to $3 million for 2014, and into negative territory for 2015 at -$9 million. In Europe, 2013 is doing fairly well, and 2014 appears to be a decent performer, but 2015 put up a massive decline to $11 million in Y0 operating income, down from 2014's Y0 operating income of $53 million.
Additionally, the regression below the table shows how our projections for total operating income through year 6 (e.g. 2015's cumulative operating income through 2021) relate to the prevailing expected-gross-collection multiple of each vintage. Most importantly, we expect the U.S. 2015 vintage to continue putting up negative opearating income, the U.S. 2014 vintage to put up a meager $22 million, and for the European 2015 vintage to perform just slightly better with $35 million in cumulative opearting income.
Here's the real takeaway. The cumulative operating income (revenues less collection costs) for the US2014, US2015, US2016, EUR2015 and EUR2016 vintages are close to (or below) zero and that's BEFORE taking into account interest expense from the debt used to finance the portfolio acquisitions. These five vintages currently account for 47% of total ERC.

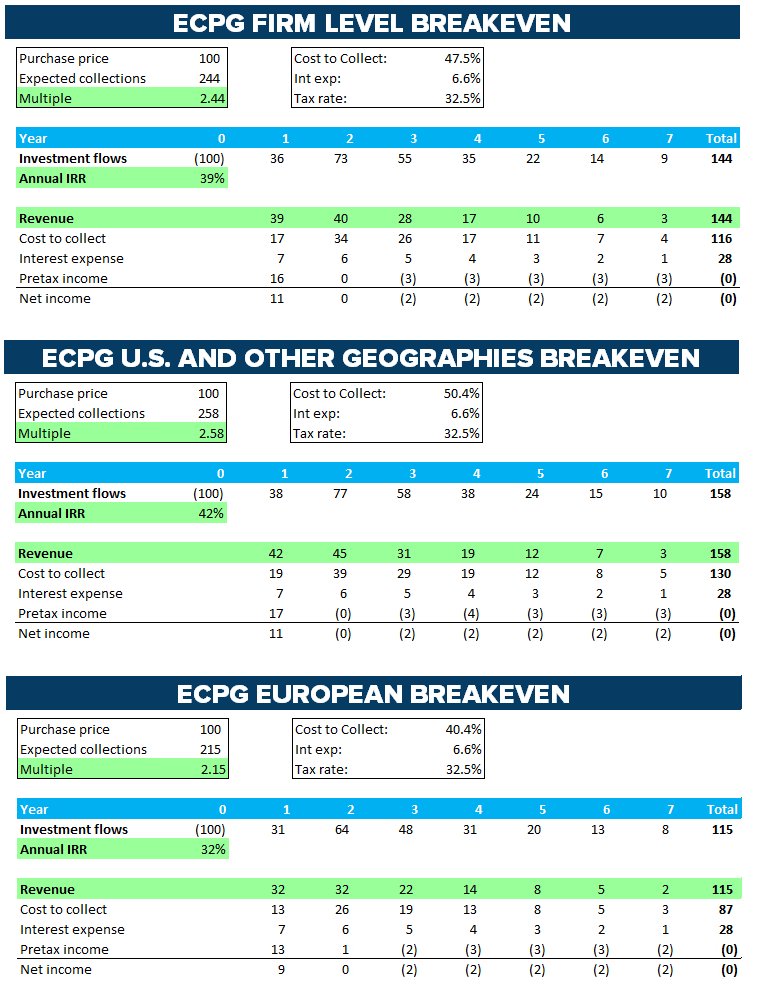
Finally, to drive this point home we provide a simple analysis of a 7-year collection pattern. The first table below uses the firm-level cost to collect of 48%. Note that this differs from Encore's reported 39% cost to collect because the 39% excludes certain reocurring GAAP items that must be considered. The 48% cost to collect that we use is simply the trailing twelve months of GAAP operating expendes excluding expenses related to CFPB one-time charges and goodwill impairment divided by the trailing twelve months of collections. Our analysis also assumes debt financing with a 6.6% interest rate and a 32.5% tax rate. Based on those inputs, the breakeven multiple of expected gross collections (“EGC”) to purchase price is 2.44x. Meanwhile, the 2014, 2015, and 2016 U.S. portfolios are below that level. In Europe, the 2014, 2015, and 2016 vintages are all below 2.44x.
We also provide this analysis on a geographic basis. The second table below shows that when considering the higher 50% cost to collect (op exp ex-CFPB and impairment / collections) specific to the U.S., the breakeven multiple is 2.58x. Considering that higher hurdle, the mix of unprofitable vintages also includes 2012 and 2006. The third table analyzes the European breakeven with that business's lower 40% cost to collect. With European breakeven coming in at 2.15x, that business has more leeway, but the 2015 and 2016 vintages are still below that level.
This severely reduced profitability in newer vintages will continue to drive down firm-level results as older vintages roll off and are replaced by newer, unprofitable books.

PRA GROUP
Declining Recovery of Purchase Price
At PRA Group, the 2012, 2013, and 2015 American Core vintages are deteriorating versus the peak vintages of 2009, 2010, and 2011. This is, again, driven by purchasing expensive paper and not making high enough collections on that paper to keep up with the pace of better performing vintages.

The decline in PRA's European business, meanwhile, is extraordinary. Each vintage in the European portfolio, which is 42% of PRAA’s ERC, is performing worse than the preceding vintage. As of 1Q16, the 2015 vintage has only recovered 17% of its purchase price versus 2014’s 29% at the same 1QY1 age. At 1QY2, 2014 has recovered only 64% versus 2013’s 93% at that age. Finally, 2013’s 90% recovery so far places it well below 2012’s 133% at 1QY3.


PRA does not break out cost to collect on a channel basis. As such, the previous charts do not deduct that cost. Therefore, we also provide the following net recovery chart on a firm-wide basis. Similarly to the before-cost recovery rates, 2012, 2013, 2014, and 2014 are underperforming the preceding vintages.
Translating to Declining Results
With the deteriorating post-2011 vintages now making up 92% of PRA’s ERC, similar to Encore, PRA’s firm-wide IRR has been deteriorating.


This dynamic at PRA has made its way into top line results even more severely than at Encore. In fact, PRAA’s firm-level revenue growth has gone negative, as the revenue growth from newer vintages is not high enough to outpace the revenue contraction in older vintages.

A big part of what’s going on here is that PRAA continues to book significant allowances to reverse revenue that it never should have booked for the 2013 and 2014 vintages. Management has argued that, under GAAP, it is being unjustly forced to record these allowance charges due to short-term changes in collection patterns while they are increasing longer term collection projections. They claim that the net present value of the upward revision to ERC for better performing vintages outweighs the shortfall of the vintages taking the allowances. However, we see this commentary as a distraction from the fact that significant allowances continue to occur. While management may be increasing projections, the shortfalls that force them to book losses continued in 1Q16 to the tune of a $9.9 million revenue hit, roughly in-line with the trend over the last few quarters.

Finally, as we did with Encore, we show that using PRA’s 41% cost to collect over the trailing twelve months, debt financing with a 4% interest rate, and a 32% tax rate, the breakeven multiple of EGC to purchase price is 1.96x. Meanwhile, the U.S. 2016 vintage being brought on is below that level, as is every European Core vintage other than 2014. It's also worth noting that unlike Encore, PRA's cost to collect is roughly the same between the US and Europe, which they showed in a footnote in a slide presentation a while back.


In summary, with new vintages continuing to come on at lower recovery rates, we expect this deterioration to continue, to worsen, and to drive PRAA’s stock price down further from its current level.
Joshua Steiner, CFA
Jonathan Casteleyn, CFA, CMT
Patrick Staudt, CFA
