


How many data points does it take to make a trend? That's a question worth asking, in light of the fact that the last three weekly initial claims prints have been sequentially higher. At the low end of the spectrum, some argue that a simple plurality (two) of datapoints constitute a trend. Most seem to think it takes three data points (i.e. 2,4,6) to conclude a trend is occurring. At the other end of the spectrum there are those who argue it takes at least four data points to have the requisite conviction needed for forecasting/extrapolating recent data into the future.
Three weeks ago, claims rose by 9k. Two weeks ago, they increased by 17k, and last week they rose by a further 20k. There are no holidays or distortions in the last few weeks of data that could account for the rise and we're not yet into the automotive furlough season.
I would suggest that the last 2-3 weeks of data are significant; the last two weeks especially, as they've shown the largest back-to-back weekly increases in initial claims YTD, and they've come consecutively (+17k, +20k). Moreover, they come directly on the heels of the weaker-than-expected April NFP report, which was measured in the week prior to the most recent 3 weeks of rising claims. In other words, taking the April NPF in conjunction with the last 3 weeks of claims data, you have ~7 weeks of weakening labor market data.
We'll see what the next few weeks bring, but I would argue that if the "trend" in initial claims continues higher over the next two weeks, the early innings of a labor recession trend are afoot.

The Data
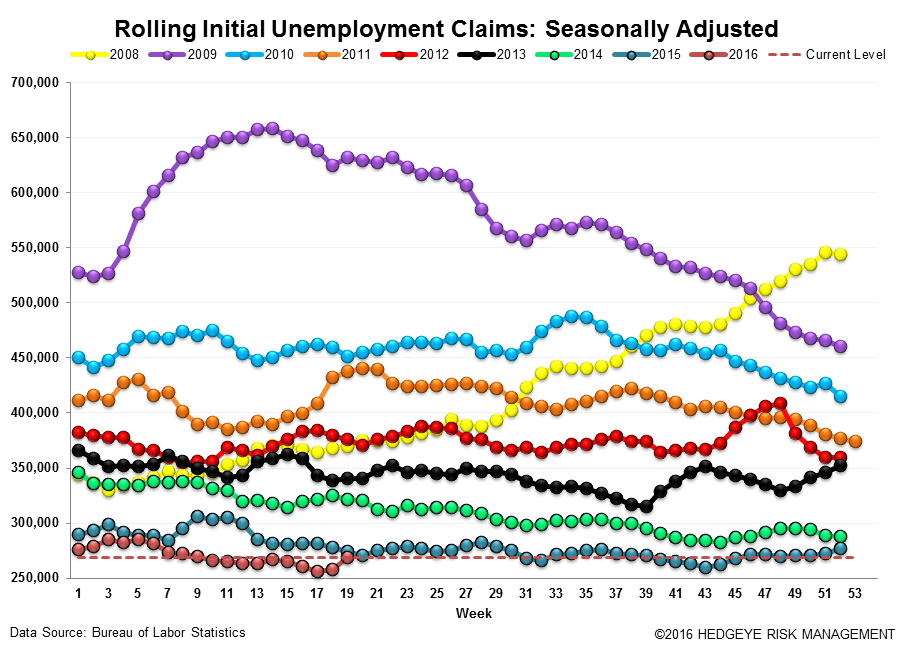
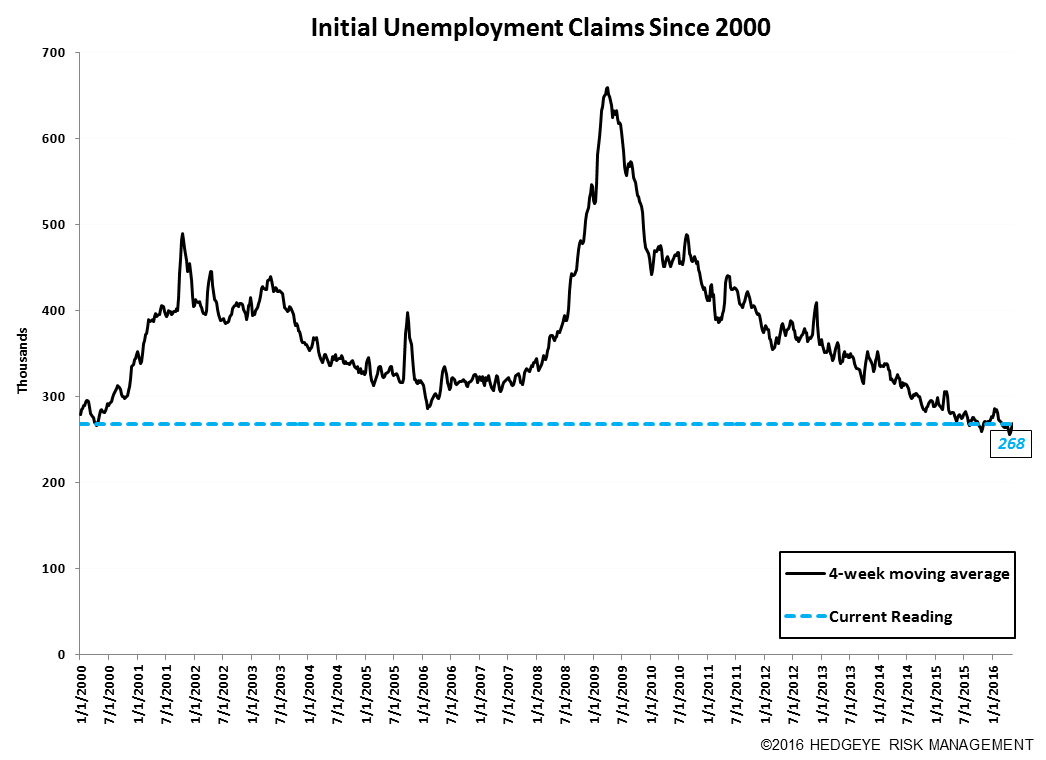
Prior to revision, initial jobless claims rose 20k to 294k from 274k WoW. The prior week's number was not revised. Meanwhile, the 4-week rolling average of seasonally-adjusted claims rose 10.25k WoW to 268.25k.
The 4-week rolling average of NSA claims, another way of evaluating the data, was -1.7% lower YoY, which is a sequential deterioration versus the previous week's YoY change of -6.9%


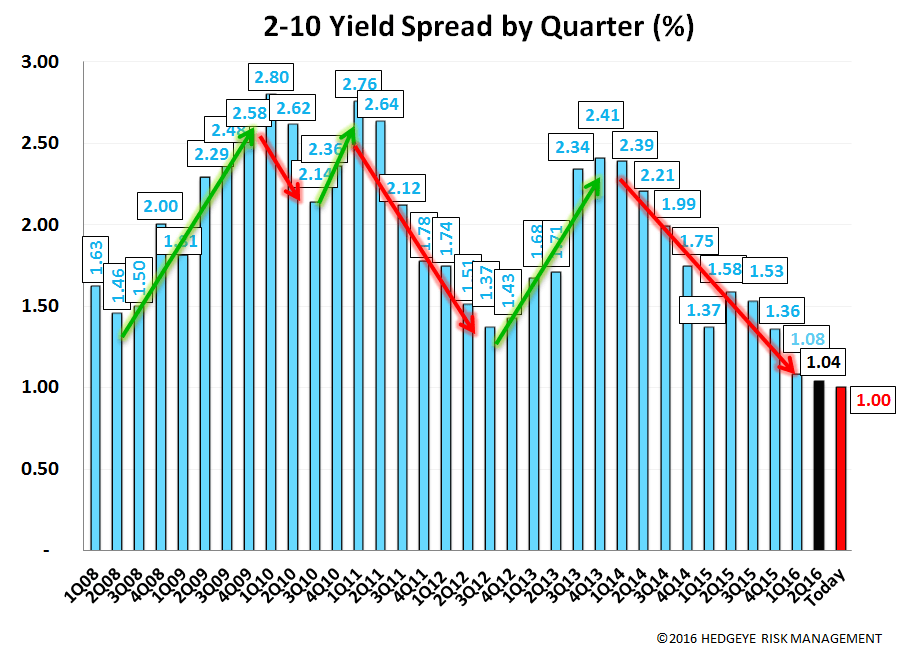
Yield Spreads
The 2-10 spread fell -3 basis points WoW to 100 bps. 2Q16TD, the 2-10 spread is averaging 104 bps, which is lower by -4 bps relative to 1Q15.

Joshua Steiner, CFA
Jonathan Casteleyn, CFA, CMT
