Investment Company Institute Mutual Fund Data and ETF Money Flow:
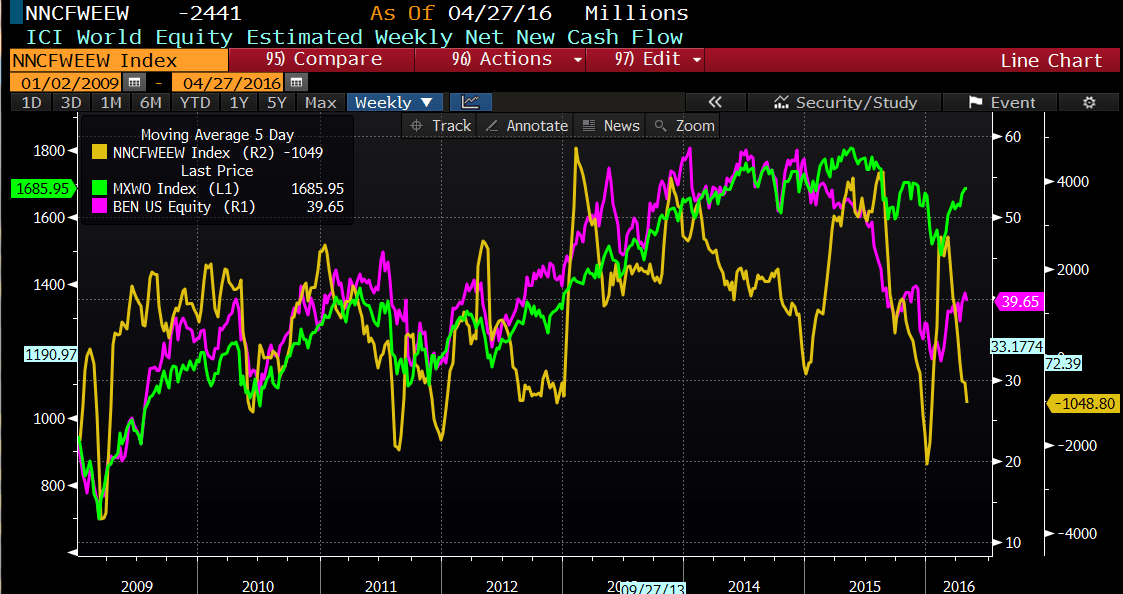
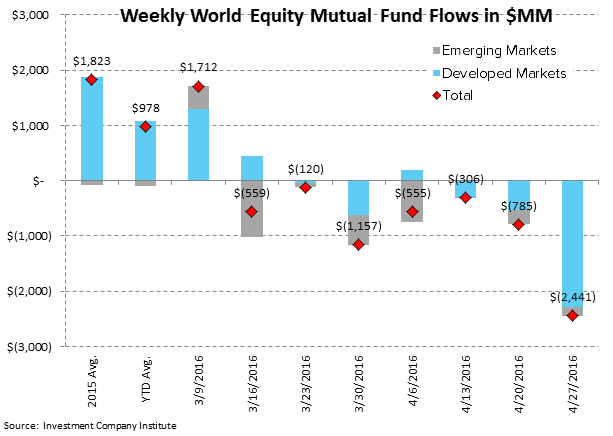
While the long standing weakness in domestic equity mutual funds continued during the week with another -$5.5 billion redemption, international equity mutual funds are now looking worse for wear with 7 straight weeks of outflows including the latest survey's -$2.4 billion outflow for the category. For the better part of this cycle, international equity funds have been positive contributors to asset management complexes as the #1 performing market every year over the past 25 years has been abroad and with financial planners evolving to global total return strategies, foreign stock mutual funds trends have been stable (only in 2008 did international stock funds have redemptions). With nearly 2 months of consecutive redemptions however and a 2016 weekly average down over -40% year-over-year from 2015, this once stalwart category is weakening. International stock fund flows (shown in orange below as a 5 week moving average) tend to track performance of the MSCI World Index and Franklin Resources (BEN) closely tracks both flows and market returns as the manager with the biggest exposure to both foreign stock and bond assets-under-management.
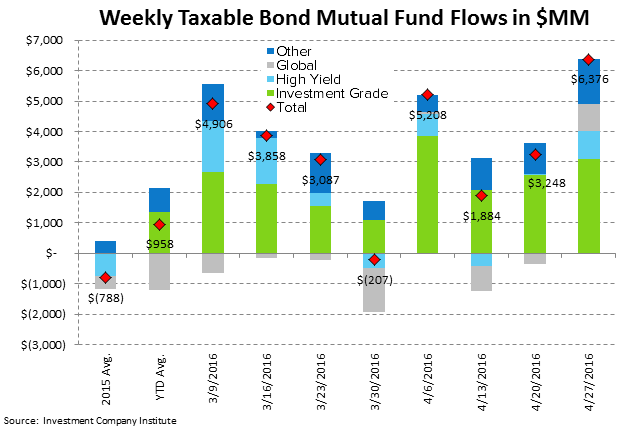
In fixed income, all bond mutual funds put up their largest inflow of the year last week, taking in +$8.3 billion as investors headed for the safety of fixed income in the actively managed space. With tax season payments winding up and incremental risk aversion during the week, investors also shored up +$10 billion in money market funds. The best performing traditional asset management stock year-to-date is Federated Investors (FII), the leading public money fund manager with 8% share of the money market industry.
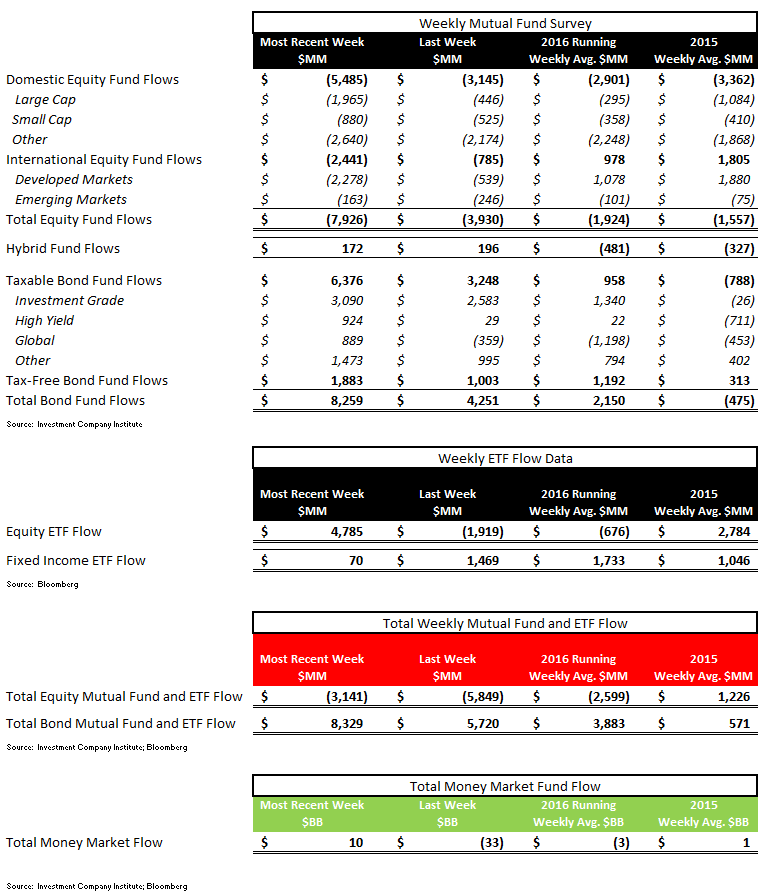
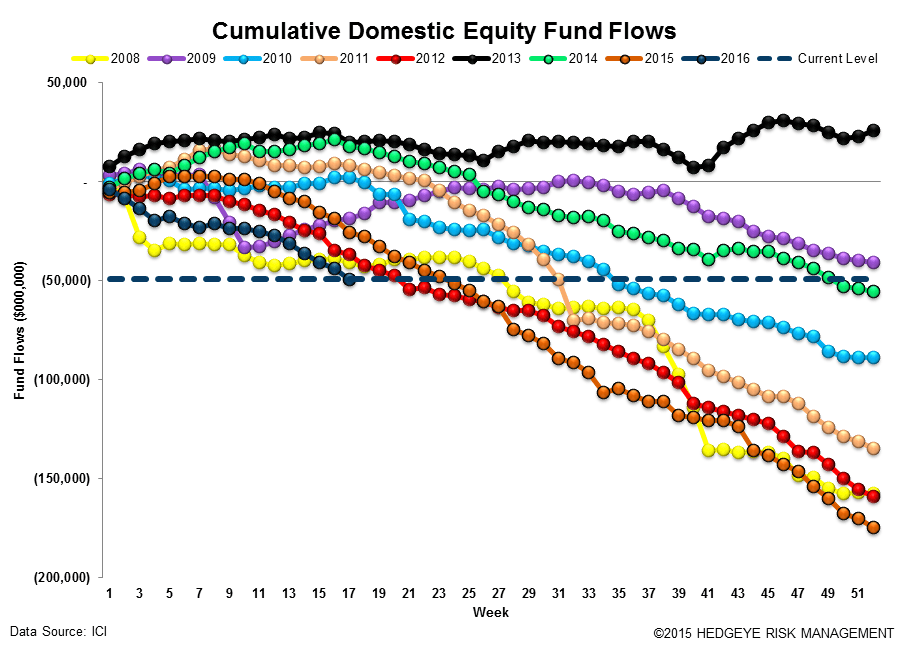
In the most recent 5-day period ending April 27th, total equity mutual funds put up net outflows of -$7.9 billion, trailing the year-to-date weekly average outflow of -$1.9 billion and the 2015 average outflow of -$1.6 billion.
Fixed income mutual funds put up net inflows of +$8.3 billion, outpacing the year-to-date weekly average inflow of +$2.2 billion and the 2015 average outflow of -$475 million.
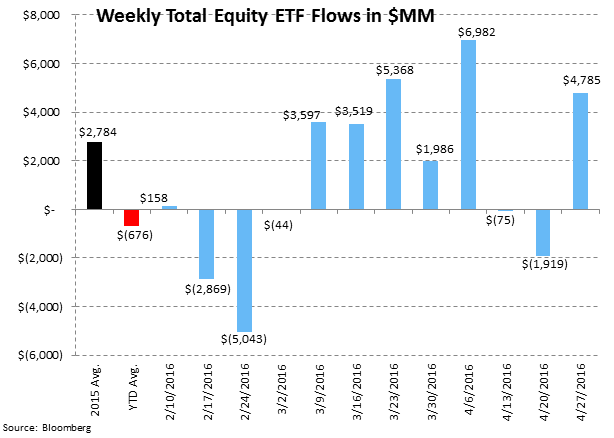
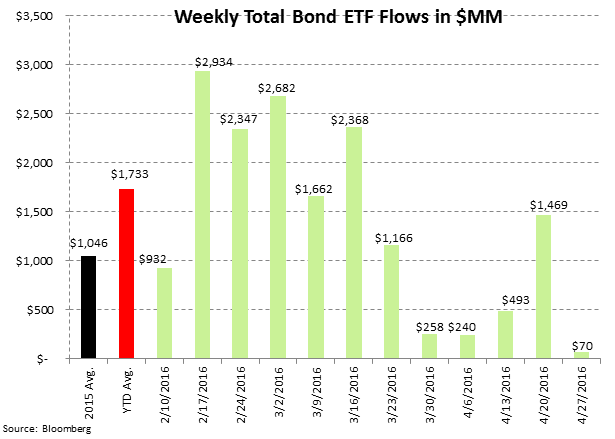
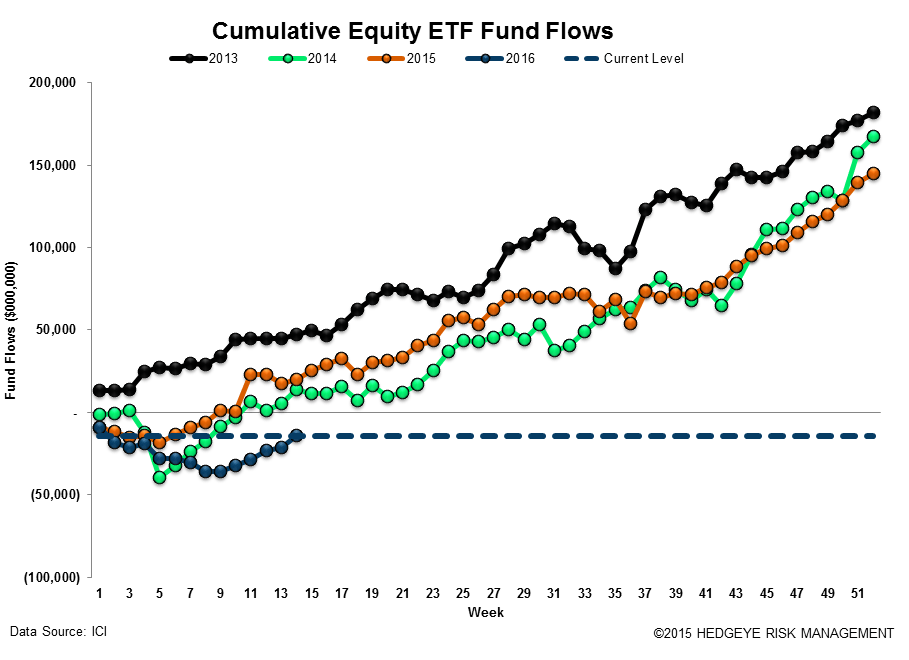
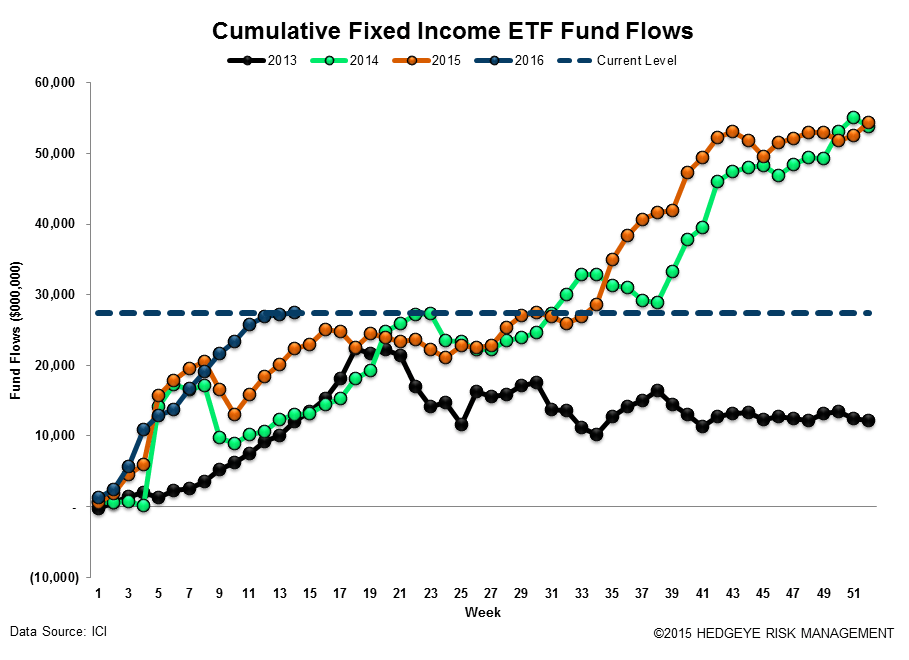
Equity ETFs had net subscriptions of +$4.8 billion, outpacing the year-to-date weekly average outflow of -$676 million and the 2015 average inflow of +$2.8 billion. Fixed income ETFs had net inflows of +$70 million, trailing the year-to-date weekly average inflow of +$1.7 billion and the 2015 average inflow of +$1.0 billion.
Mutual fund flow data is collected weekly from the Investment Company Institute (ICI) and represents a survey of 95% of the investment management industry's mutual fund assets. Mutual fund data largely reflects the actions of retail investors. Exchange traded fund (ETF) information is extracted from Bloomberg and is matched to the same weekly reporting schedule as the ICI mutual fund data. According to industry leader Blackrock (BLK), U.S. ETF participation is 60% institutional investors and 40% retail investors.
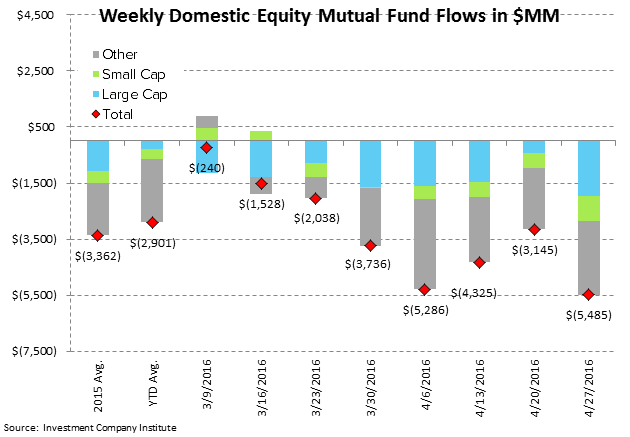
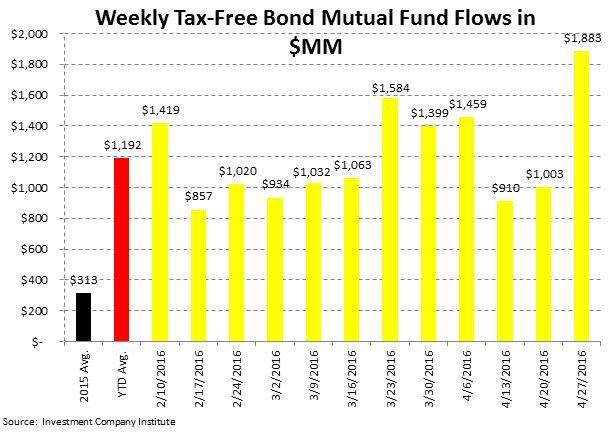
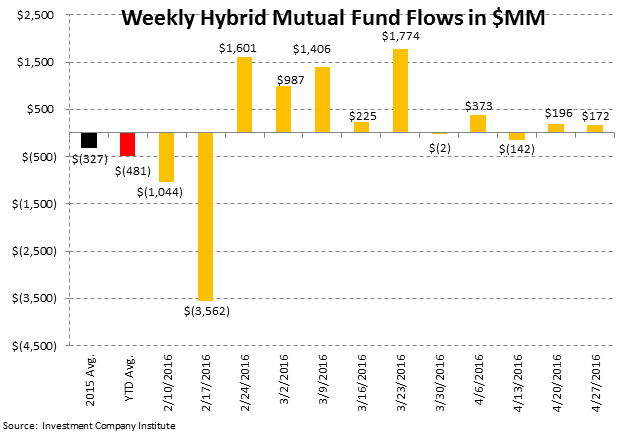
Most Recent 12 Week Flow in Millions by Mutual Fund Product: Chart data is the most recent 12 weeks from the ICI mutual fund survey and includes the weekly average for 2015 and the weekly year-to-date average for 2016:
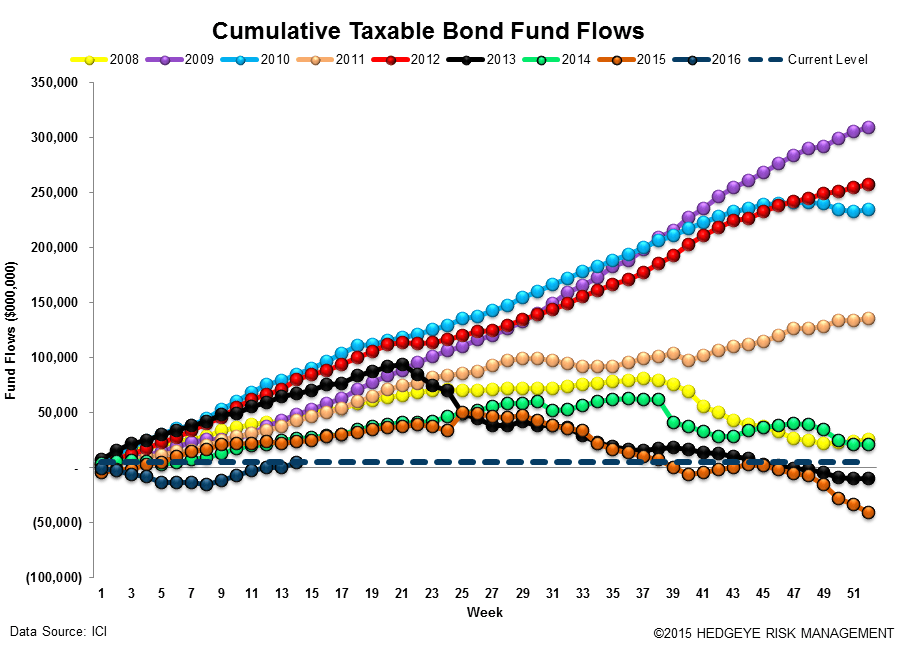
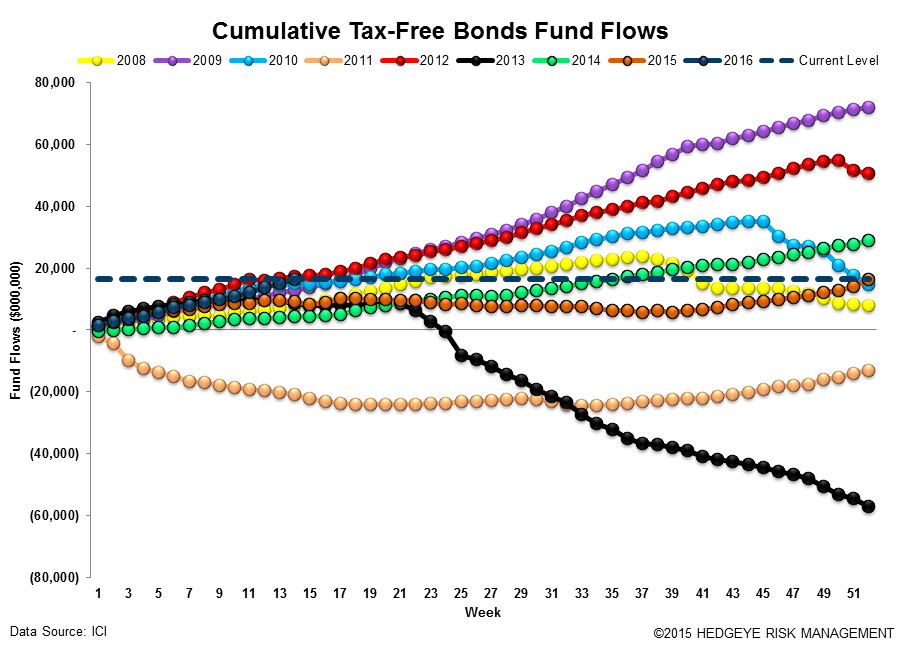
Cumulative Annual Flow in Millions by Mutual Fund Product: Chart data is the cumulative fund flow from the ICI mutual fund survey for each year starting with 2008.


Most Recent 12 Week Flow within Equity and Fixed Income Exchange Traded Funds: Chart data is the most recent 12 weeks from Bloomberg's ETF database (matched to the Wednesday to Wednesday reporting format of the ICI), the weekly average for 2015, and the weekly year-to-date average for 2016. In the third table are the results of the weekly flows into and out of the major market and sector SPDRs:
Sector and Asset Class Weekly ETF and Year-to-Date Results: In sector SPDR callouts, investors pulled a whopping -$672 million from the XLP consumer staples ETF, -7% of the fund's market cap.

Cumulative Annual Flow in Millions within Equity and Fixed Income Exchange Traded Funds: Chart data is the cumulative fund flow from Bloomberg's ETF database for each year starting with 2013.
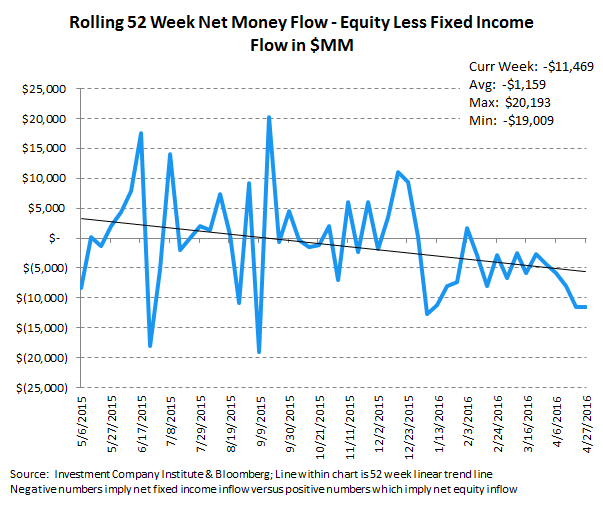
Net Results:
The net of total equity mutual fund and ETF flows against total bond mutual fund and ETF flows totaled a negative -$11.5 billion spread for the week (-$3.1 billion of total equity outflow net of the +$8.3 billion inflow to fixed income; positive numbers imply greater money flow to stocks; negative numbers imply greater money flow to bonds). The 52-week moving average is -$1.2 billion (negative numbers imply more positive money flow to bonds for the week) with a 52-week high of +$20.2 billion (more positive money flow to equities) and a 52-week low of -$19.0 billion (negative numbers imply more positive money flow to bonds for the week.)
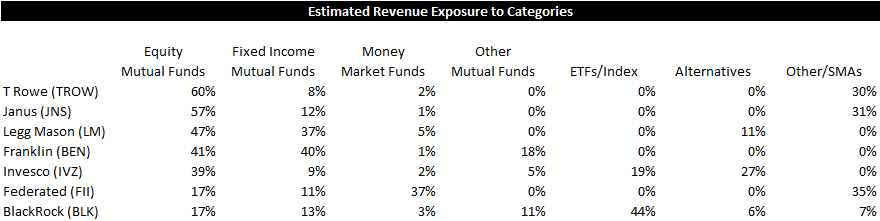
Exposures: The weekly data herein is important for the public asset managers with trends in mutual funds and ETFs impacting the companies with the following estimated revenue impact:
Jonathan Casteleyn, CFA, CMT
Joshua Steiner, CFA