We’re adding HBI to our Best Ideas Short list. We initially put this short on in late March (see note below), but the company’s actions since then have given us greater confidence in the call. Here’s our basic thinking (we’ll have a Black Book out on the name shortly with a deep dive).
- This is not a bad business…but it’s not a good one. On the plus side, it’s highly consolidated on the brand side – with Hanes and Fruit of the Loom accounting for 24% share. On the flip side, distribution is even more consolidated with Wal-Mart, Target, Kohl’s, Penny, and (yes) Amazon accounting for ~70%. That might seem like a push, but we’d also argue that consumer trends are pushing towards the high end (Tommy John, Lululemon, UnderArmour, Nike). All in, the core is probably a 1% long term grower. Nothing to write home about. And unlike a CPG company, it is extremely volatile. A volatile 1%? Not where we want to be.
- Margins are at peak. HBI’s own manufacturing plants account for roughly 65%. While the company guards these numbers closely, our sense is that utilization is likely running close to 90%. That’s actually to management’s credit, as they’ve got this engine running like a 911 Turbo. But where’s it going to go from here?
Most retail analysts don’t cover companies that actually own manufacturing assets. They all have offshore/outsourced models that lock in price, limit volatility, and make it such that the company has to worry only about design, sales and marketing. The point is that margins for these ‘other’ brands might move by 1-2 points in a year. But for a company like HBI that owns its own assets, we could see 4-5 point swings with no problem as demand shifts and factory utilization drops.
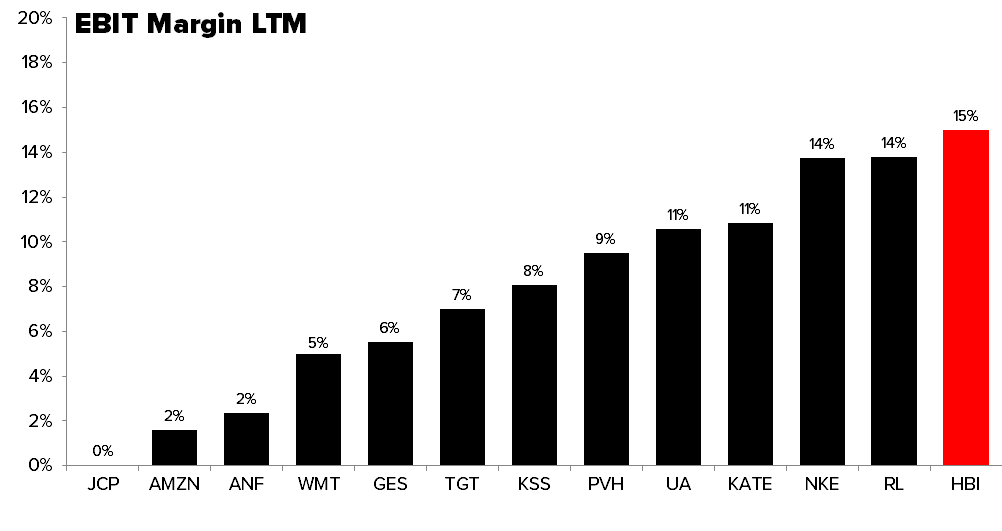
In the end, we ask the question…why should HBI have higher margins (15%) than VF Corp, PVH, Ralph Lauren, and even Nike? We should note that it’s about on par with Gildan, which interestingly is the only other major company that buys cotton directly in such quantities for use in company-owned plants. - The New ‘Jones’? No, we’re not talking about Hedgeye’s illustrious Daryl Jones, we’re talking about Jones Apparel Group – one of the worst companies in retail. Ever. And that says a lot. As its core rolled, Jones took capex down from 2-3% of sales to about 0.7%. That’s bad. It took shareholders’ capital and bought assets/brands – over 25 of them. Then it took special charges almost every quarter obfuscating the real earnings power of the company. It was a great trading stock until it ultimately went private at 30% of peak trading levels. We’re not certain this is where HBI is headed, but the parallels are uncanny.
- Management is investing away from the core. Maybe this is an exceptional idea. Maybe they’re doing what VFC did a decade ago when grew away from its stodgy old slow growing denim business, and sold off its underwear assets. But VFC bought things like Vans, Timberland, Lucy and Eagle Creek. HBI is diversifying into…you guessed it – underwear (and moderate priced sports apparel). Just in other parts of the world. We have no reason to think this category will grow any more outside the US than inside its borders.
- These deals are getting more expensive. HBI bought DB Apparel for 7.5x in 2014, Knights Apparel for 8x in 2015, and now both Champion Europe and Pacific Brands cost 10x EBITDA. Basically, HBI is trading at a 20% lower multiple (tho still expensive) than it was, but it’s deal multiples are 20% higher. Why?
- Why didn’t HBI buy Pacific Brands a year ago at half the price? That’s kind of a rhetorical question. I have no idea what the answer is. But it’s a public company…it’s not like it ‘wasn’t for sale’, and it’s also not like ‘HBI wasn’t a buyer’. Just strange to pay nearly $400mm more for the same asset. That could have otherwise paid down 18% of debt, or bought back 3% of the float.
- 2 and 20 is Back! Did we mention that HBI announced two acquisitions in 20 days? One in Europe, and the Other in Australia? I’m sorry, but even if you’re the biggest bull on this name, you’ve gotta be scratching your head over this. Yes, I know, the stock was up on both deals, because people know that the company now has a cookie jar to dip into for a year or two. But we’ll bet against two international deals/20 days any day of the week when we’re at the tail end of an economic cycle.
The Bottom Line
We think it’s absurd for a stock like HBI to trade at an EBITDA multiple in the teens. An EARNINGS multiple? Sure. But not EBITDA. We understand, however, that this is the type of name where there will need to be a major event to make people completely revalue the company – the way it did so on the upside as it repaired its balance sheet over the past two years. But until then, will we see the multiple push to 14x, 15x? We have a hard time with that one – unless we’re grossly underestimating a) how much juice it can squeeze out of the lemon in Australia, or b) the sustainability of its positioning in the US market. If we’re right, we’re looking at 7-8x EBITDA, and we’d argue that’s even generous. That’s a stock in the mid-teens, or 50% downside.
Here is our previous note on HBI from 3/29.
HBI | Short the Tighty Whities
Takeaway: Margins and EPS at peak. Company buying stock when mgmt selling. Estimates 20% high next yr and 40% by yr3. HBI should be a high teen.
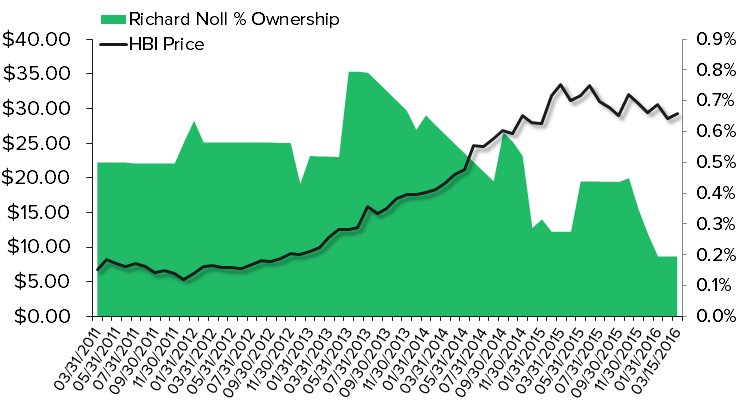
We added HBI to our short list yesterday. We don’t like the Brands, don’t like Management, and don’t like the Company, but that alone is no reason to short a Stock. What is, however, is the fact that we think that earnings and margins are at peak. We’re 7% below consensus this year, -20% in ’17, -30% in ‘18, and -40% by year 3. Some argue that stock might seem cheapish today at a mid-teens multiple and 5% FCF Yield – though we really don’t follow that logic. Once the dust clears from the acquisitions, special charges, and cotton prices normalize from the 7-year low, we think we’ll be looking at lower multiples on lower earnings and cash flow. A low double-digit multiple on our numbers gets us to a high-teenager. We don’t like high teenagers. Perhaps management agrees, especially CEO Noll who has cut his stake in half over four months.

Here are some factors to consider…
1) Why? Can someone, ANYONE, explain to me why HBI has operating margins of 15%? That’s demonstrably higher than the following companies – UA, RL, PVH, GES, CRI, ANF, KATE, and yes – even NKE. It’s also well above its key retailers (WMT, TGT, KSS, JCP, AMZN). Why should a company whose primary brand sells through mass channels and department stores have higher margins than the best brands in the business? As hard as we try, we cannot figure it out aside from over-earning due to a 7-year trough in cotton prices and the temporary benefit of being a serial acquirer and restructurer of companies in an effort to grow away from its core.
2) Let’s consider how the margin structure changed at HBI over the past 4-years. Cotton peaked in the market at about $2.00 in 2011, which ultimately flowed through and hit HBI’s margins in 2012. That was when the stock was at a split-adjusted $5. Overly penalized, for sure. But we’d argue we are seeing the inverse today. Since the precipitous decline in cotton to the $0.57 level we see today (a 7-year low and near a 20-year low), HBI recouped seven (7) full points in Gross Margin. Over the same time period, how much did the company see flow through to EBIT margin? Seven. Ordinarily, we’d like to see a company invest more of the upside. They’ll say they ‘innovate to elevate’. But we’ll bet there’s a direct flow through in margin downside if either a) cotton prices head higher, or b) if Wal-Mart and Target decide that HBI is making too much money.

3) Buying at the Top? HBI buying so much stock when margins are at all-time peaks (and management is selling) comes across to us as flat-out reckless. In fairness to HBI management, we see this behavior from most major consumer companies – they buy stock when they CAN and not when they SHOULD. This is not unlike Target, which is taking the incremental $1.2bn it gained from its pharmacy business and using it to buy back shares at $80. Our sense is that it will come back to haunt them if we’re right on earnings and this stock is in the high teens.
4) Acquisition Behavior Bothers Us. This company has acquired an average of a company a year for 5-years for a total of $1.5bn. It’s also taken $546mm in restructuring charges, or 25% of non-GAAP EBIT, since the Maidenform acquisition in October 2013.
5) As hard as it might try, HBI can simply not grow online. If there was only one statistic we could see for a consumer brand to gauge the health of its business, it would be the direct to consumer (DTC) sales of its product. DTC sales at HBI, however, have shrunk as a percent of sales over the past 5 years from 9.5% to 6.8%. We’ve never seen a company do that before. Our sense is that WMT, TGT, the Department Stores, and Dollar Stores all would react severely if HBI tried to go direct. And yes, we understand that WMT and AMZN sell Hanesbrands online, which counts as a wholesale sale on the P&L but shows up online. It does not matter. Margins are better for a direct sale full-stop. We refuse to accept the premise that underwear is not a category that lends itself to online sales. Tell that to Tommy John, Lululemon, and UnderArmour, who all have 30-40%+ online businesses and are charging $30-$40 per pair (not package), and they can hardly keep them in stock. It’s abundantly clear where the trend is going – and HBI can innovate all it wants, but it’s likely not going to be a player in this premium game.
6) When management buys a share of stock, we’ll step back and question our logic (though we’ve done that a few times already). We have seen an absolutely massive degree of selling from the management team over the past year – see Rich Noll’s selling activity below. Specifically, he has sold $85mm in stock over the past 14 months, most of that +/- $2 of where it is trading today.