

Our Hedgeye Housing Compendium table (below) aspires to present the state of the housing market in a visually-friendly format that takes about 30 seconds to consume.

Today’s Focus: March Pending Home Sales
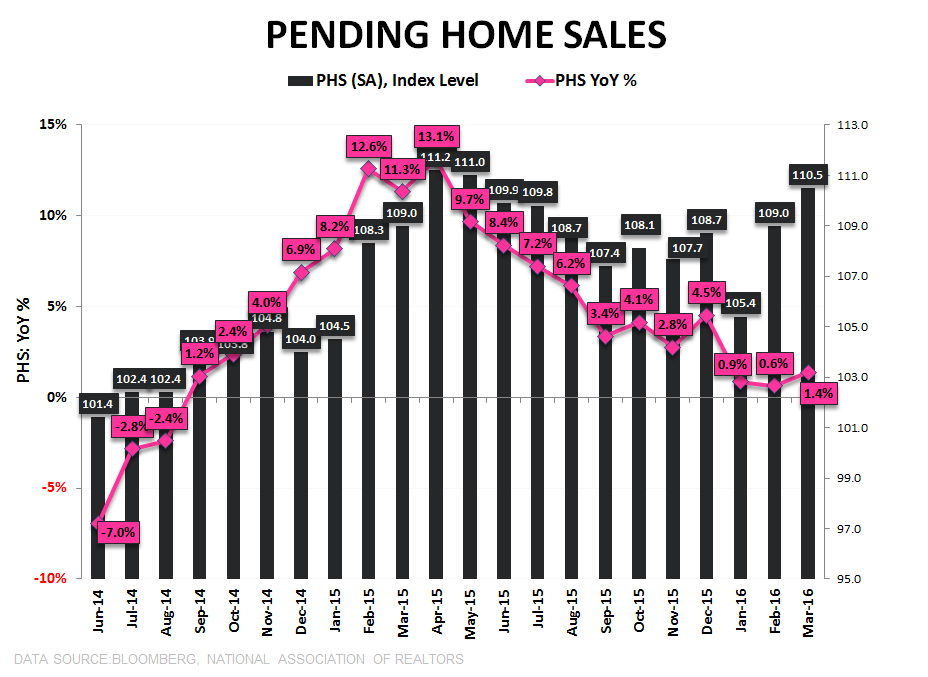
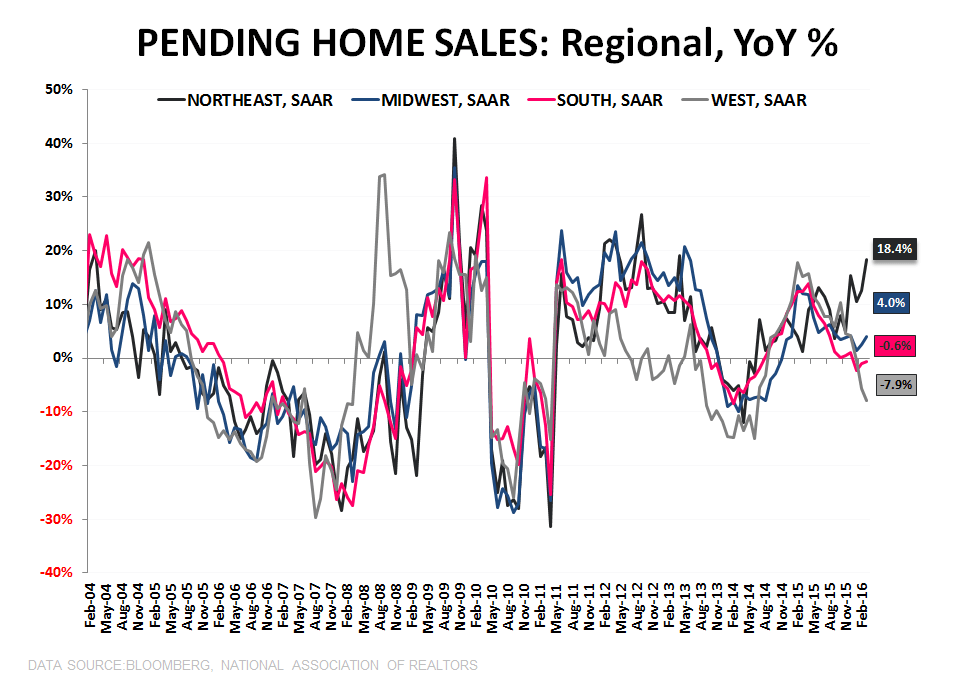
Pending Home Sales in March rose +1.4% sequentially and accelerated +70bps sequentially to +1.4% year-over-year. Much of the strength was driven by the strong +18.4% comp out of the Northeast, which likely has weather written all over it.
That +1% YoY growth could be considered “a beat” speaks well to the prevailing environment.
If there was an official Hedgeye Housing Manifesto, the primary prescriptive notion would be that everything that matters happens on the margin. That is, the forecasting goal centers on divining better/worse not good/bad and front-running those inflections.
The current challenge – with HMI, NHS, Starts, & PHS all flat for the last year - is that nothing is really happening at the margin and a crawling 2nd derivative convergence to zero isn’t alpha’s playground.
To frame-up and put some quick context around the nearer-term setup: Demand comps in the existing market get harder the next few months and, at current levels of activity, transaction volumes would be down ~-1% in Apr/May. If continued sequential improvement were to persist, demand growth would run 0% to +2% YoY over the next quarter+.
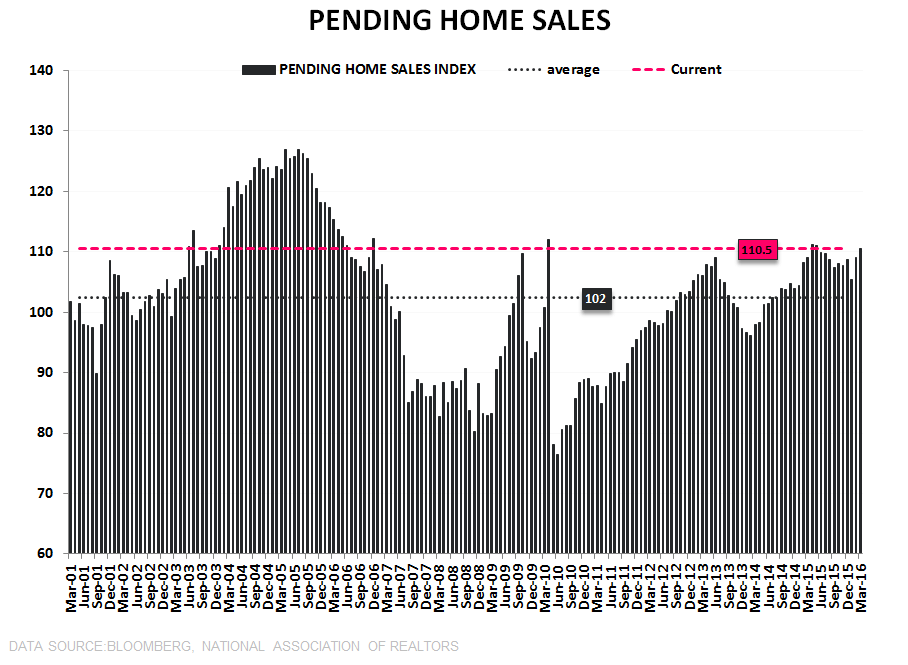
So, -2%-to-+2% is your fundamental demand backdrop through the balance of 1H16. Note, also, that (unlike NHS/Starts) existing sales have already fully mean-reverted back above average historical levels of activity so the easy asymmetry/upside has already been captured.
Summarily, with demand stagnating, price growth beginning to roll, supply constraints persisting, the preponderance of domestic macro data decelerating and no discrete, large-scale catalysts we're not seeing much for housing bulls to hang their hat on here presently.
About Pending Home Sales:
The Pending Home Sales Index is a monthly data release from the National Association of Realtors (NAR) and is considered a leading indicator for housing activity in the US. It is a leading indicator for Existing Home Sales, not New Home Sales. A pending home sale reflects the signing of a contract, but not the closing of the transaction, which occurs 1-2 months later. The NAR uses data from the MLS and large brokers to calculate the Pending Home Sales index. An index value of 100 corresponds to the average level of activity during 2001.
Frequency:
The NAR Pending Home Sales index is released between the 25th and the 31st of each month and covers data from the prior month.
Joshua Steiner, CFA
Christian B. Drake
