Our Hedgeye Housing Compendium table (below) aspires to present the state of the housing market in a visually-friendly format that takes about 30 seconds to consume.

Today’s Focus: New Home Sales for March
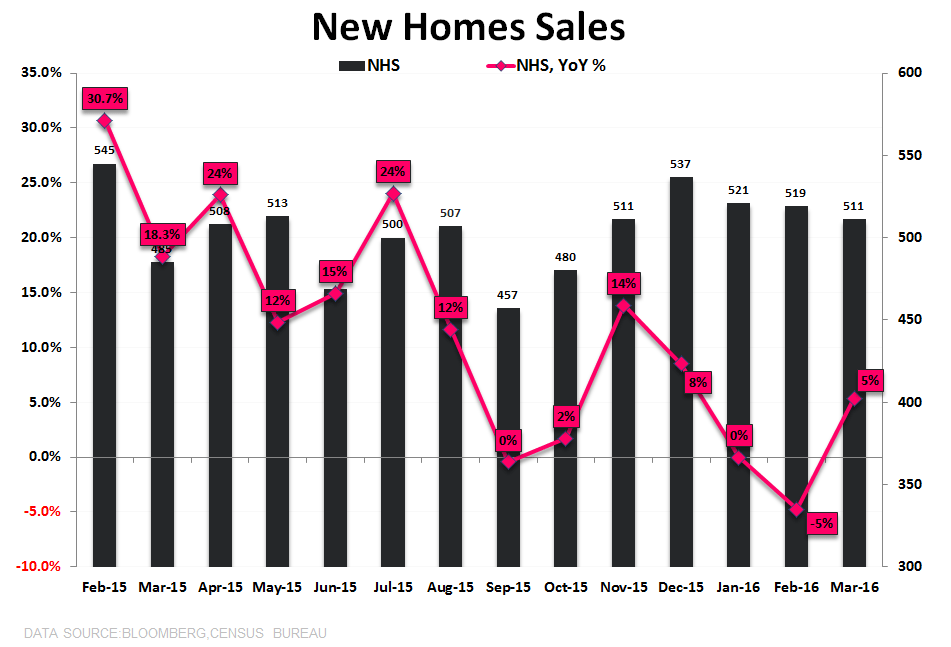
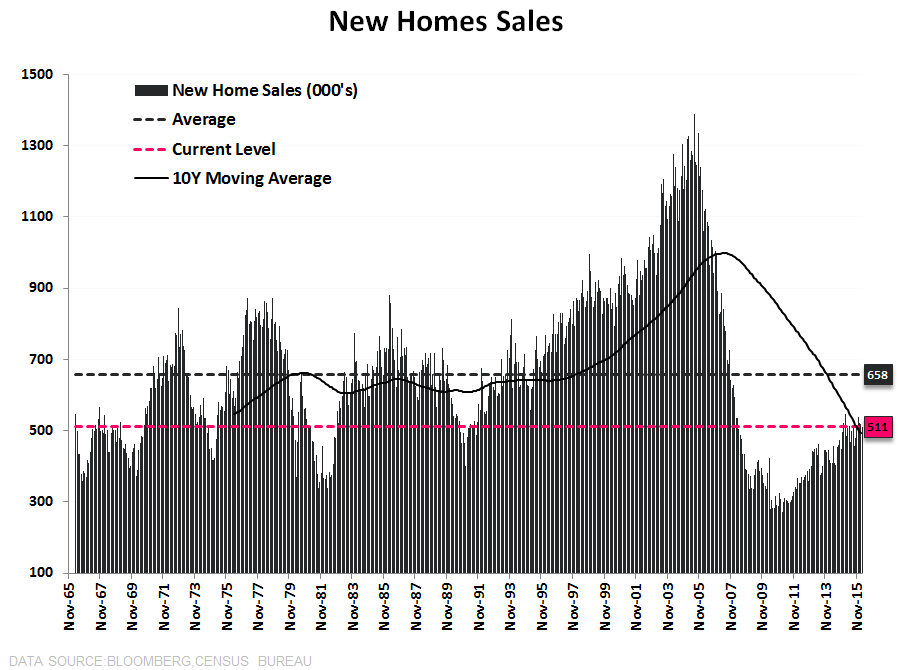
New week, same data trend as 'the nothing' continues to propagate across domestic housing activity. New Home Sales declined -1.5% sequentially and were (only) up +5.4% YoY against easy March comps. Similar to Starts & Builder Confidence, New Home Sales volumes over the TTM have completely flatlined (1st chart below).
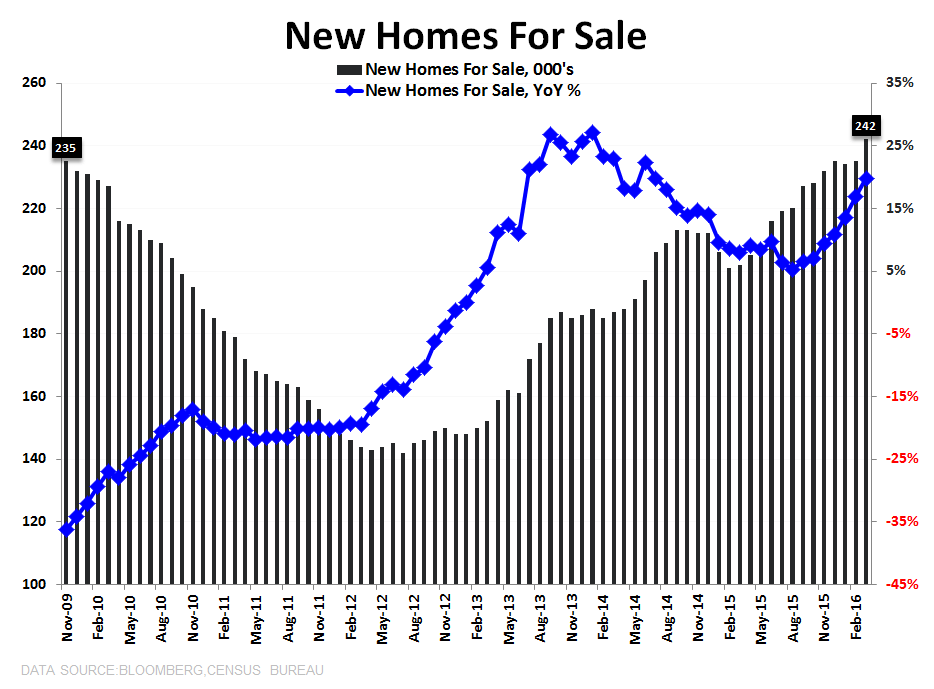
- Inventory: continues to rise with For Sale Inventory up +3% MoM and +19.8% YoY; 242K Units in march = highest since October 2009.
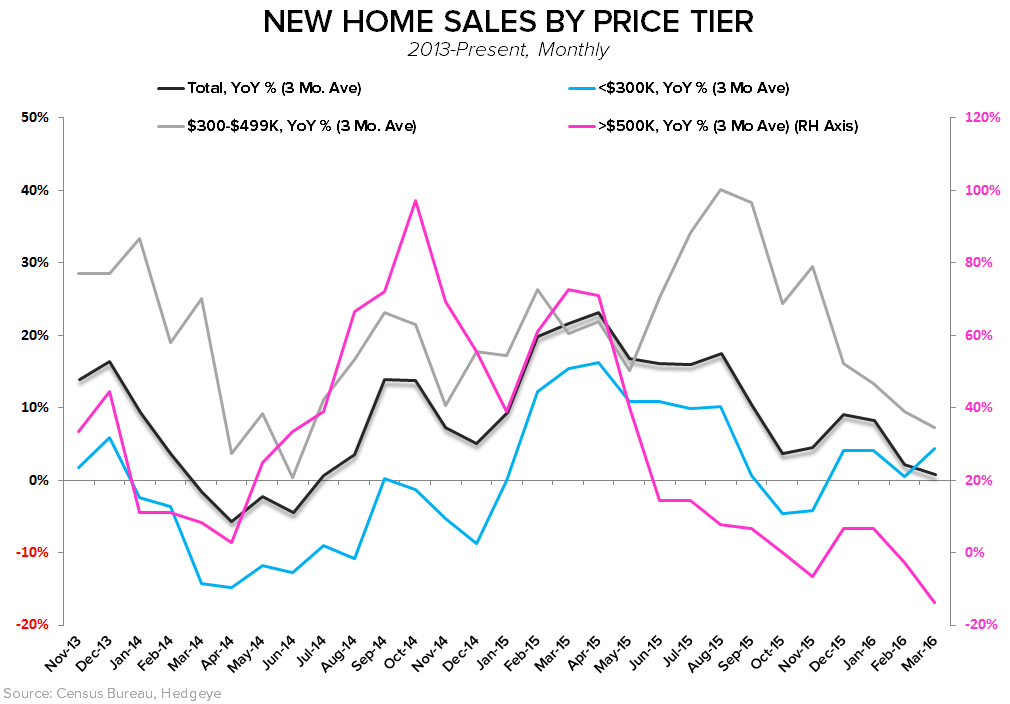
- Sales By Price Tier: While the slowdown in the lower end (Sub-300K) has moderated the trend toward deceleration continues to characterize the middle and higher-end.
In short, New Home Sales closed 1Q on a stagnation-ary note and continue the sideways trend of no growth broadly present across the US Housing complex.


About New Home Sales:
Each month the Census Department releases the New Home Sales report, which measures the number of newly constructed homes that have been sold in the month. The difference between the New Home Sales report and the Starts and Permits report is that New Home Sales only includes single family spec homes built and sold by builders, and does not include condos, apartments, or owner-built units. This is why New Home Sales typically run at roughly half the rate of Starts.
Joshua Steiner, CFA
Christian B. Drake