

Key Takeaway:
Chinese stimulus has reflated the world, for now. The FT reported this weekend (HERE) that Chinese debt grew by 6.2 Trillion CNY in the first quarter of 2016 (~$930 billion USD). This brought total Chinese debt to ~$25 Trillion USD and marked the fastest pace of quarterly debt growth on record. In fact, in the ~8yrs since 2007, China has grown its debt from 148% of GDP to 237%. While that level of debt puts China roughly in line with the EU & US on a debt/GDP basis, the pace of debt accumulation is the issue.
Consider this. The US saw staggering growth in credit from 2000 to 2008. Total US Single family mortgage debt outstanding grew from $4.8 trillion at the start of 2000 to $11.3 trillion at the start of 2008, an increase of $6.5 trillion (+137%) over eight years. China, by comparison, has seen total private credit grow from ~$3 trillion (USD) at the end of 2007 to ~$25 trillion as of 1Q16. That's $22 trillion in growth (USD), or roughly +633% over eight years. What's even more remarkable is that the pace of growth - on a much larger denominator - has accelerated of late. Even George Soros is concerned (HERE).
If we think back to the low watermark in US equities, it was set on Feb 11, 2016. What's now clear in hindsight is that it was this torrid growth in Chinese credit that arrested the fall. The chart below of Chinese Steel prices provides an illustration of just how sharp the bounce has been since mid-February.

Current Ideas:

Financial Risk Monitor Summary
• Short-term(WoW): Positive / 4 of 13 improved / 3 out of 13 worsened / 6 of 13 unchanged
• Intermediate-term(WoW): Positive / 6 of 13 improved / 3 out of 13 worsened / 4 of 13 unchanged
• Long-term(WoW): Negative / 2 of 13 improved / 2 out of 13 worsened / 9 of 13 unchanged

1. U.S. Financial CDS – Swaps tightened for 10 out of 27 domestic financial institutions and the median CDS tightened by -11 bps to 86 as investors continued to reach for optimism.
Tightened the most WoW: GS, BAC, C
Widened the most WoW: HIG, AIG, AXP
Tightened the most WoW: GS, MS, BAC
Widened the most MoM: UNM, XL, AGO

2. European Financial CDS – Financial swaps mostly tightened in Europe last week. Greek bank swaps stood out, tightening between -78 and -258 bps as the country made progress in its bailout discussions with creditors, agreeing that it would implement extra austerity measures if it failed to reach budget targets.

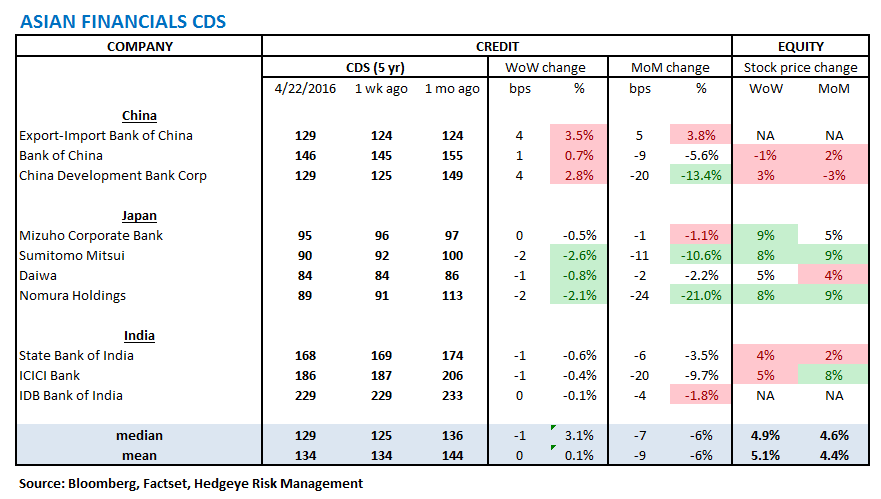
3. Asian Financial CDS – Aside from in China, financial swaps tightened in Asia last week. In particular, Japanese bank swaps tightened on hopes for further stimulus from the BoJ.
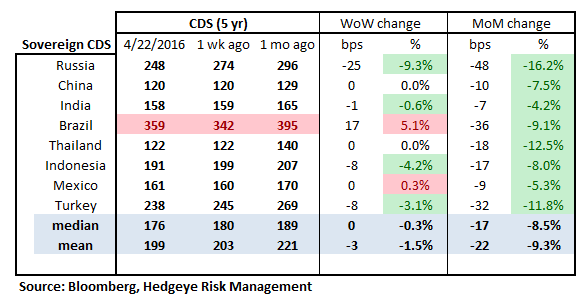
4. Sovereign CDS – Sovereign swaps were mixed last week. Portuguese sovereign swaps stood out, tightening by -11 bps to 261 as the country announced plans to cut its budget deficit in 2017.


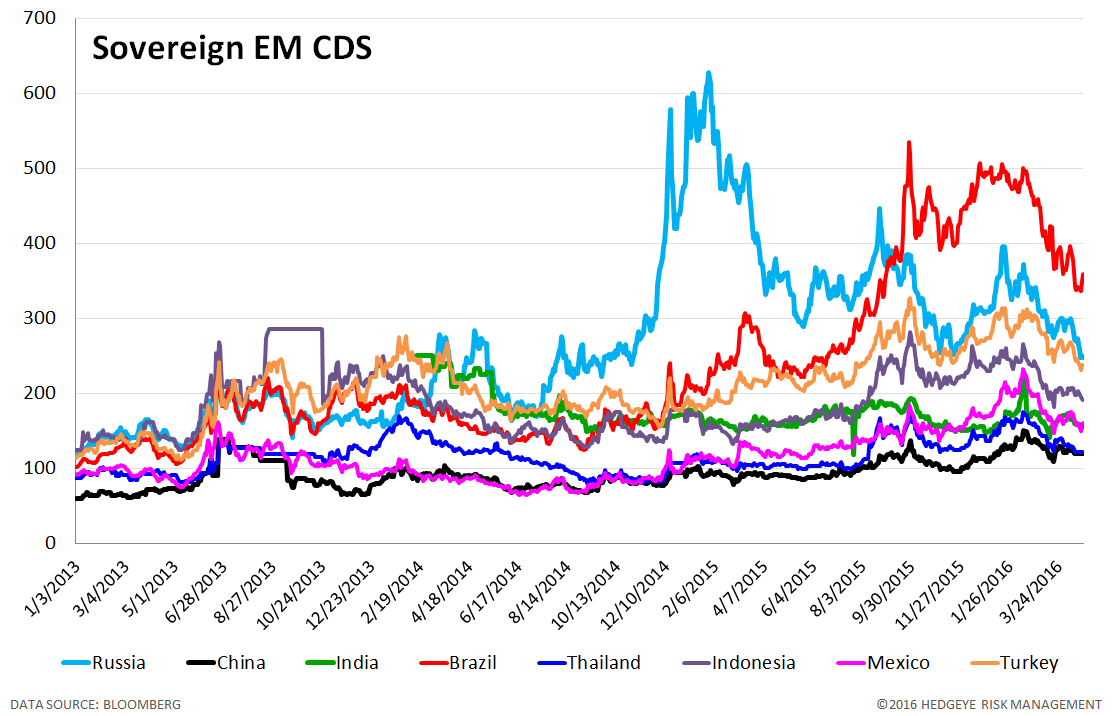
5. Emerging Market Sovereign CDS – Emerging market swaps mostly tightened last week. However, with the politically volatile situation in Brazil, Brazilian sovereign swaps widened by 17 bps to 359. Russian swaps tightened by -25 bps to 248 as investors brushed off the non-decision out of Doha.
6. High Yield (YTM) Monitor – High Yield rates fell 9 bps last week, ending the week at 7.51% versus 7.60% the prior week.

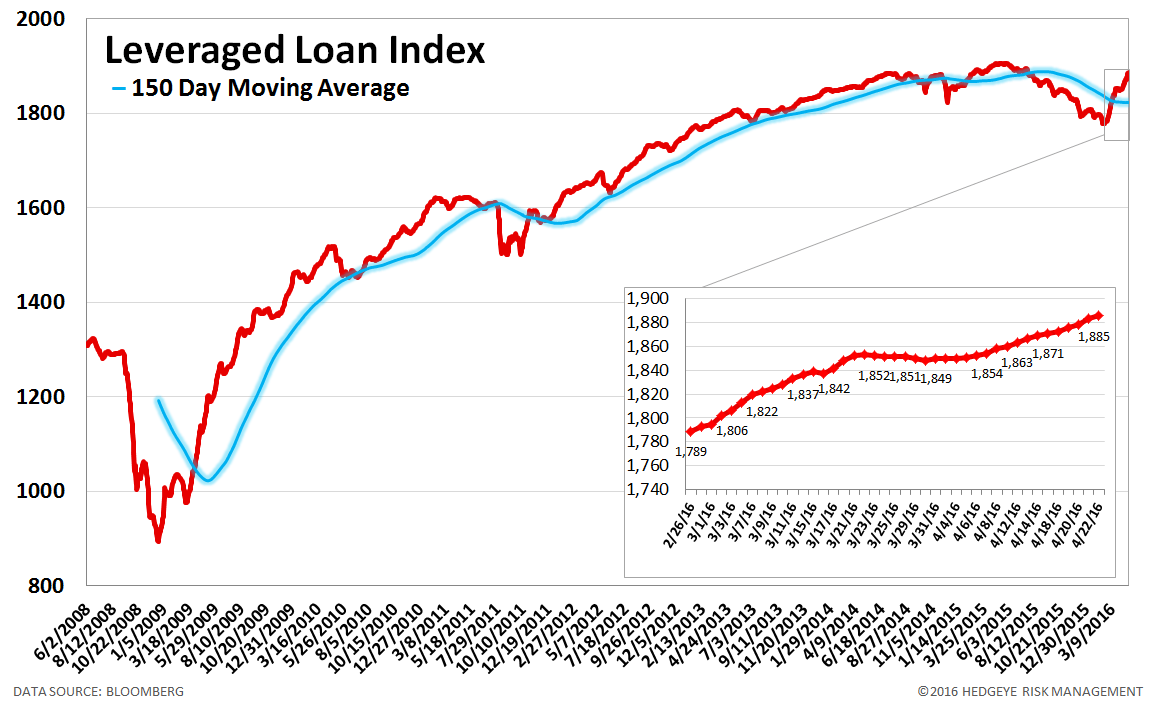
7. Leveraged Loan Index Monitor – The Leveraged Loan Index rose 14.0 points last week, ending at 1885.
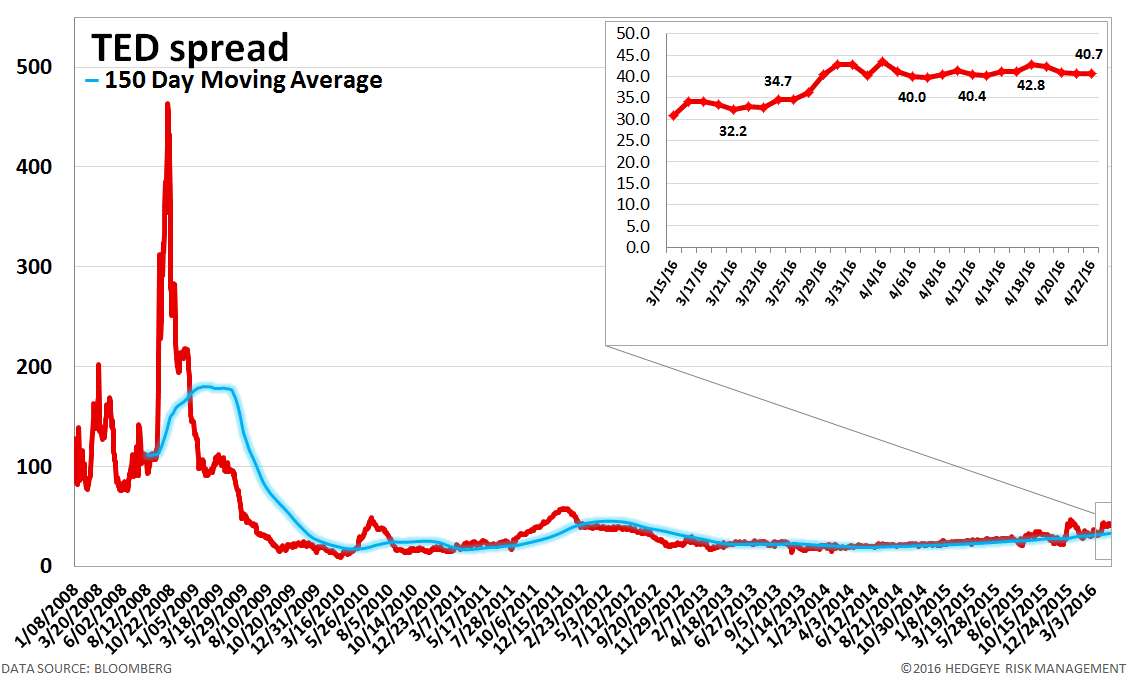
8. TED Spread Monitor – The TED spread fell 1 basis point last week, ending the week at 41 bps this week versus last week’s print of 41 bps.
9. CRB Commodity Price Index – The CRB index rose 2.3%, ending the week at 180 versus 176 the prior week. As compared with the prior month, commodity prices have increased 4.3%. We generally regard changes in commodity prices on the margin as having meaningful consumption implications.

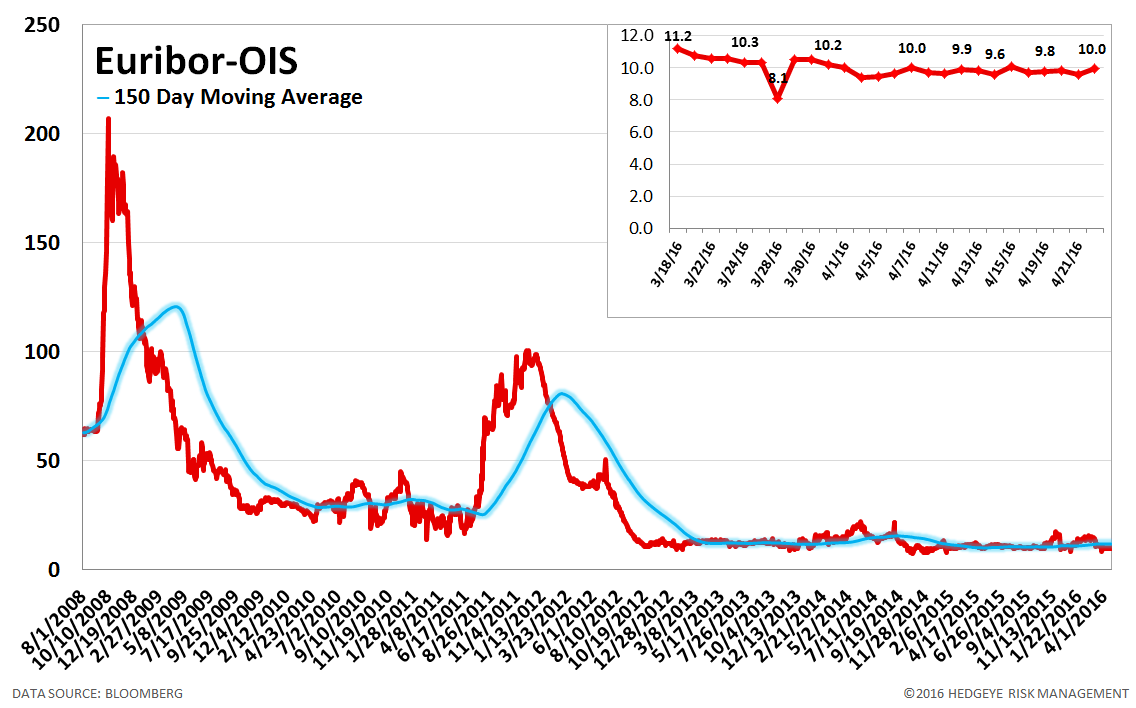
10. Euribor-OIS Spread – The Euribor-OIS spread (the difference between the euro interbank lending rate and overnight indexed swaps) measures bank counterparty risk in the Eurozone. The OIS is analogous to the effective Fed Funds rate in the United States. Banks lending at the OIS do not swap principal, so counterparty risk in the OIS is minimal. By contrast, the Euribor rate is the rate offered for unsecured interbank lending. Thus, the spread between the two isolates counterparty risk. The Euribor-OIS spread was unchanged at 10 bps.
11. Chinese Interbank Rate (Shifon Index) – The Shifon Index rose 4 basis points last week, ending the week at 2.04% versus last week’s print of 2.00%. The Shifon Index measures banks’ overnight lending rates to one another, a gauge of systemic stress in the Chinese banking system.

12. Chinese Steel – Steel prices in China rose 10.3% last week, or 295 yuan/ton, to 3147 yuan/ton. We use Chinese steel rebar prices to gauge Chinese construction activity and, by extension, the health of the Chinese economy.
13. Chinese Non-Performing Loans Chinese non-performing loans amount to 1,274 billion Yuan as of Dec 31, 2015, which is up +51.2% year over year. Given the growing focus on China's debt growth and the potential fallout, we've decided to begin tracking loan quality. Note: this data is only updated quarterly.

14. 2-10 Spread – Last week the 2-10 spread widened to 107 bps, 5 bps wider than a week ago. We track the 2-10 spread as an indicator of bank margin pressure.

15. CDOR-OIS Spread – The CDOR-OIS spread is the Canadian equivalent of the Euribor-OIS spread. It is the difference between the Canadian interbank lending rate and overnight indexed swaps, and it measures bank counterparty risk in Canada. The CDOR-OIS spread widened by 1 bps to 42 bps.

Joshua Steiner, CFA
Jonathan Casteleyn, CFA, CMT
