

With the largest Capital Markets operation reporting results this week, JP Morgan's numbers continue to relay the business-to-business (B2B) shift in both bond and equity markets. With capital hamstrung by Financial Crisis era regulation, and fixed income desks running tight as a drum, brokerage activity continues to shift over into the exchange traded derivative markets. JPM's FICC or fixed income trading results hit $3.5 billion in revenue in 1Q16, down 13% year-over-year. Conversely, the daily reporting of CME Group's bond volumes finished at 8.2 million contracts per day in 1Q, up +9% from last year. On a revenue basis, CME's results are actually a little stronger, with fixed income rate per contract up +2% year-over-year. The shift in equities is more balanced, with JPM's equity trading revenues up +6% y-o-y according to their latest report. CME's stock volumes however still outflank the big brokerage desk with futures and options volume up +9% y-o-y for the forthcoming quarterly report on April 28th.

Weekly Activity Wrap Up
Cash equity volume kept pace with last week's strength, coming in at 7.0 billion shares traded per day and keeping the 2Q16TD average daily volume (ADV) at that same level, +10% higher than one year ago in 2Q15. Additionally, volume of futures traded through CME and ICE picked up the pace week over week, rising to 18.2 million contracts traded per day and bringing the 2Q16TD ADV to 17.9 million, +2% higher than the year-ago quarter. Furthermore, CME's open interest currently tallies 112.9 million contracts, +24% higher than the 91.3 million pending at the end of 2015. This compares to ICE's OI growth of just +5.1% since the beginning of the year. Lastly, options volume was stronger week over week, rising to 16.1 million, but the 2Q16TD ADV remains -2% lower Y/Y at 15.0 million.

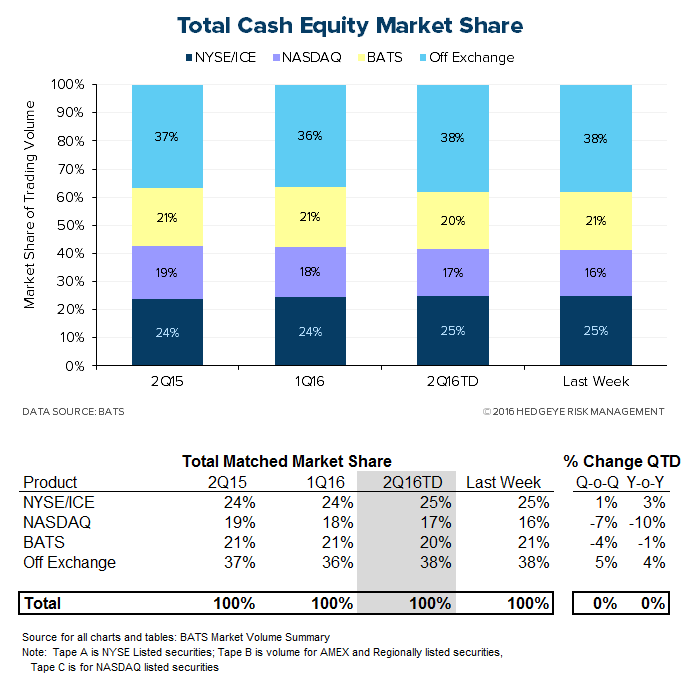
U.S. Cash Equity Detail
U.S. cash equities trading came in at 7.0 billion shares per day this week, bringing the 2Q16TD ADV to 7.0 billion. That marks +10% Y/Y growth. The market share battle for volume is mixed. The New York Stock Exchange/ICE is taking a 25% share of second-quarter volume, which is +80 bps higher Y/Y, while NASDAQ is taking a 17% share, -178 bps lower than one year ago.

U.S. Options Detail
U.S. options activity came in at a 16.1 million ADV this week, bringing the 2Q16TD average to 15.0 million, a -2% Y/Y contraction. In the market share battle amongst venues, although NYSE/ICE's share jumped week over week and its 18% share of 2Q16TD volume is +92 bps higher Y/Y, it has been trending downwards recently. Additionally, CBOE's 24% market share of 2Q16TD is down -309 bps Y/Y. Meanwhile, NASDAQ is doing well in the first two week of 2Q16, taking a 22% share, +70 bps higher than one year ago. BATS has also been taking share from the competing exchanges, up to an 11% share from 10% a year ago. Finally, ISE/Deutsche, which experienced market share growth through 1Q16, has stagnated recently at 15%, which is -103 bps lower than 2Q15.


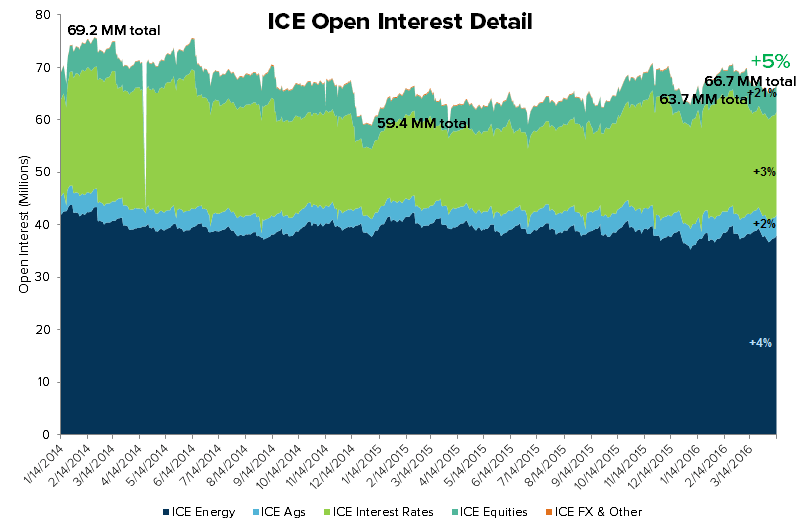
U.S. Futures Detail
13.7 million futures contracts per day traded through CME Group this week, bringing the 2Q16TD ADV to 13.5 million, +1% higher Y/Y. Additionally, CME open interest, the most important beacon of forward activity, currently sits at 112.9 million CME contracts pending, good for +24% growth over the 91.3 million pending at the end of 4Q15, an expansion from last week's +20%.
Contracts traded through ICE came in at 4.5 million per day this week, bringing the 2Q16TD ADV to 4.4 million, a +2% Y/Y expansion. ICE open interest this week tallied 66.7 million contracts, a +5% expansion versus the 63.7 million contracts open at the end of 4Q15 and an improvement from last week's +3%.


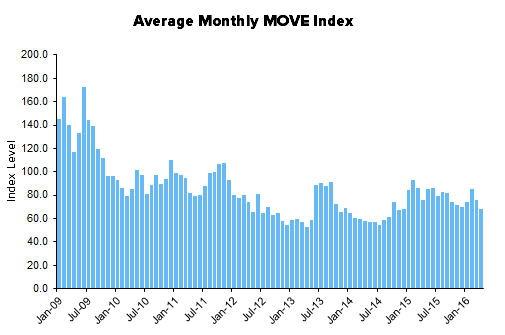
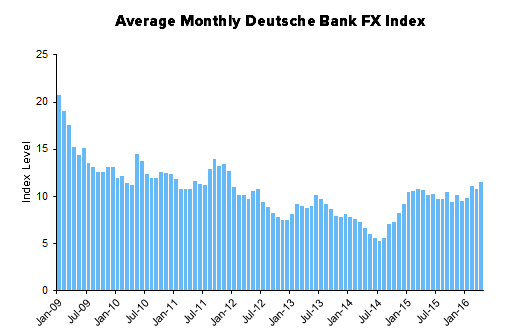
Monthly Historical View
Monthly activity levels give a broader perspective of exchange based trends. As volatility levels, measured by the VIX, MOVE, and FX Vol should rise to normal levels after the drastic compression this cycle, we expect all marketplaces to experience higher activity levels.


Please let us know of any questions,
Jonathan Casteleyn, CFA, CMT
Joshua Steiner, CFA
