

We presented our thoughts on why we added LULU back to our Best Ideas short list in a 65-page Black Book earlier this week. Here’s the link to the replay and materials.
LULU Black Book: CLICK HERE
Video Replay: CLICK HERE
Audio Replay: CLICK HERE
Though we’d encourage watching the video to capture all of our nuances and arguments, we clipped some of the more salient slides and pasted below.
Key Conclusions
1) Added back to our Best Ideas list as a short: Any way we cut it, we think that LULU management is going to have to back away from its long-term growth plan. Without converting to a wholesale model – which we think is critical – the growth math in its core market does not work. Int’l, ivivva, and Men’s are all fine. But, ALL are significantly lower return.
2) Timing matters, and that’s our only real concern: The bulls are likely chuckling over our concern about long term growth. After all, the brand has momentum, 1Q guidance is conservative, and though off its highs, short interest is 21% of the float. But over $60, you’re paying top decile price for a volatile average-grower with declining returns. At this point, LULU HAS TO BEAT meaningfully, and we’ll take the under on that one.
3) Someone’s got to man-up (woman-up would be better): Some very big decisions need to be made at LULU. And they’ll be costly up front in terms of the talent needed to drive industry-leading innovation at many more price points to new consumers in all distribution channels. Without that beacon, there’s no way an stock should trade at 3.5x sales.
Hedgeye vs. Consensus: Not wildly below consensus over the near term. But what we think is overlooked in the Bull case on LULU is how dependent this model is on margin recovery over the near-term and stabilization over the long-term at the same time that top-line growth gets more expensive (Men’s, Int’l, ivivva, bigger stores). The margin recovery story is contingent upon management’s ability to execute to perfection over the near-term – something that’s become an oxymoron in Vancouver. The company has gotten a free pass as it has pushed its margin recovery targets from 1H16 to 2H16. But once we get past 1Q16, the rubber will meet the road for this company. Expectations aren’t overly optimistic in the short-term, but LULU needs to beat meaningfully to justify the multiple with the stock in the mid-60’s.

Sq. Ft. Growth Slowing, Comp Benefit Rolling Over: LULU is no longer a sq. ft. growth story. That may sound strange given how loud the conversation is around the Int’l opportunity, but the math suggests that 2015 was the peak year of new sq. ft. comp benefit. As the base of stores (now 363) reaches critical mass, we’ve seen deceleration in square footage growth from 30% in 2011 to high-teens in 2015, and to mid-teens in 2016. Stores aged 0-3 years (i.e. in the key part of the maturation curve to drive comp growth) account for 40% of the portfolio. That ticks down in every year from here on out – to 20% of the portfolio by 2020. That means we will need to see either a) outsized category growth, which has been best in the apparel category since 2008, or b) outsized market share gains at LULU amidst stepped up competition from copycat brands and women’s investment at NKE and UA. As comp tailwinds from sq. footage growth dry up, we think it encourages return dilutive behavior, including accelerated Int’l growth and entering markets in the US where the spending and population demographics do not support the 4-wall model we have come to expect from LULU (more on this below).

Growth Away From Core = Lower Margin Profile: Today, LULU’s core business (which we characterize as the US and Canada) accounts for 92% of sales and 104% of EBIT. From here, the company is investing a boatload of capital into the non-core future topline growth vehicles (Men’s, Int’l, ivivva), which will take the revenue mix from 90%+ core to 75% by 2020. Don’t get us wrong, there is nothing wrong with diversyfying a business model (we think LULU should do wholesale). But the problem herein lies in the expectation that LULU can get both topline reacceleration AND margin recovery as it moves the mix away from the most profitable and mature parts of the business in the US and Canada.
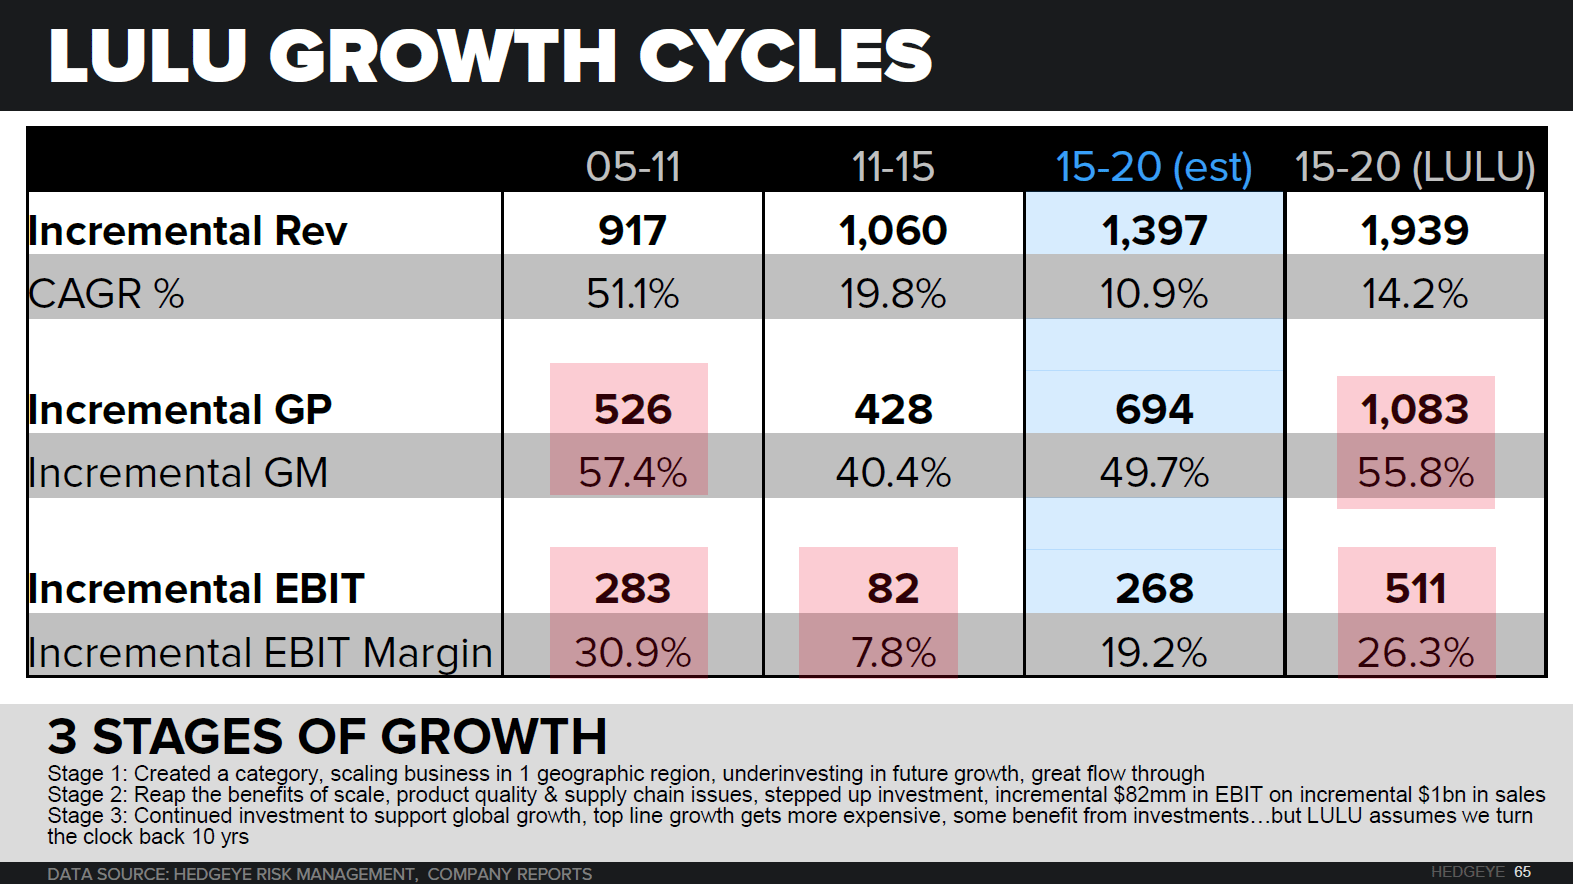
Before we discuss the future margin growth algorithm, we think it’s important to understand what we will call the 3 stages of growth at lululemon.
- Stage 1 – Unit growth: 150 doors, Sales: $100mm to $1bn, Margins: 4% to 29%. LULU created a category and benefited from scale across one geographic region (North America). Along the way, the company underinvested in the back of the house, hence the astronomical flow-through. On an incremental $900mm in sales, the incremental gross profit and EBIT margin was 57% and 31%, respectively.
- Stage 2 – Unit growth: 189 doors, Sales: $1bn to $2bn, Margins: 29% to 18%. On the plus side, benefited from scale across the portfolio. On the negative side, felt the pain from years of underinvestment in the infrastructure needed to support a $2bn revenue footprint. Stagnant Canadian growth, international forays, and opening stores in less productive markets in US. Over a 4yr time period added $1bn in sales, and an incremental $82mm in EBIT.
- Stage 3 – Unit growth: 240 doors, Sales: $2bn to $3.5-$4bn, Margins: 18% to 18% (Hedgeye) or low-20’s (LULU). We’ll stick to the LULU game plan for now. Over the next 5 years, the company is guiding to an incremental $2bn in revenue as it benefits from the investments made over the past 18 months in supply chain and go to market processes. The company is expecting a reversion to the stage 1 growth profile. That includes a 56% incremental gross margin and 26% incremental EBIT margin on $2bn in sales.
We think that’s a pipe dream for many reasons, but we’ll stick to the math to support our argument. The punchline is that as LULU shifts incremental growth away from the core businesses, we will see an offset to the margin recapture over the near and long-term. Assuming steady state margins in the mid-to-low 20’s in the core US and Canadian markets and a meaningful improvement in the profitability at ivivva (+150bps per year) and in Int’l from a net loss over the next 2 years to a +10% op margin by 2020, we get to steady state margins in the high-teens. That comes from mix shift alone. Further downside in the model could be recognized if we see a step up in the competitive environment as copycats gain critical mass and/or investments from Nike and UA into the women’s category payoff. That will = higher competition, less consumer acceptance of price increases, higher promotions, and lower gross margins in the US.

Even in the US, Growing Away from the Core. Our analysis shows that the new markets entered each year in the US have increasingly inactive consumers. The chart below takes only the new US markets added in each year, and then layers over the percent of people who practice Yoga and who Run. The trend is headed unmistakably lower for each. In other words, as each new store/market is opened in the US, there is a lower likelihood that the women in the surrounding area demand such specialized product.

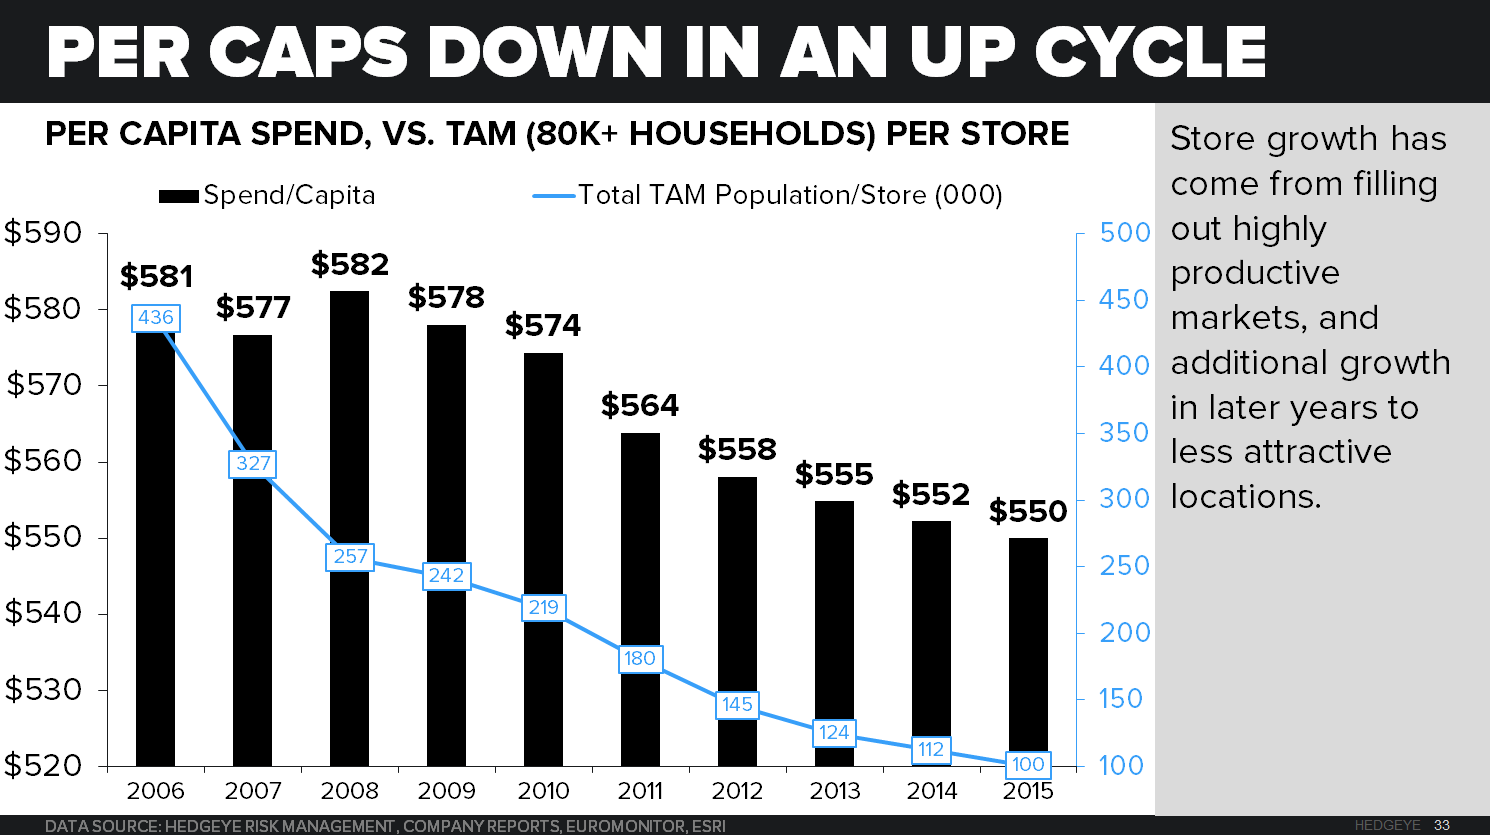
Per Caps Down While Growing in an Up Eco Cycle. This chart shows that for each new market added, the per capita spend is increasingly lower than the year before. In other words, the consumers in the incremental markets are lower quality, that either can’t afford it, or don’t need it.
Int’l Needs To Recapture Lightning In A Bottle, But Won’t: For starters, let’s just recognize the geographical complexity associated with scaling a specialty retail concept across the globe. We can think of only a handful of concepts who have been able to gain geographical relevance at a profitability level that did not dilute returns. Specifically Victoria’s Secret and GPS in its heyday. At LULU though, we are not talking about a country approach like LULU taking over China (complex enough in its own right), but a full-scale regional model centered on key markets across a vast geographic region in Europe and Asia – across language borders, and a varying array of customer tastes.
LULU’s $1bn sales target assumes an incremental $850mm over the next 5 years from the combination of growth from Asia (which initials reads suggests has been exemplary) and Europe (a little less than excellent).
Here’s how that math works…
- A net addition of 100 stores. 20 stores in Europe and Asia by 2017, and 10 additional in each region per year through 2020 plus an additional 10 net doors in LatAm.
- Comps of 30% for 5 years. It’s happened before at LULU, so it would be irresponsible for us to say that 30% comps for 5 years would be impossible. But, a) LULU captured lightning in a bottle in the US, creating a new category in the process, b) brand awareness was much higher than it currently is in Europe and Asia. LULU US had a 65 store footprint (it took it up to 171) and a $100mm revenue base vs. Asia and Europe at 12 doors and $50mm in revenue, and c) LULU has created a whole host of copycats in the time it took the brand to develop an international game plan, i.e less market opportunity without brand investment.
- New store productivity of 75% in order to compensate for the fact that Australia/NZ is lower productivity relative to openings we’ve seen in EurAsia, trailing off to 60% in the out years. To date, we’ve absolutely seen some home runs in London and Hong Kong ($7mm and $8mm stores, respectively), but that’s not sustainable and assumes that LULU would trend well past peak domestic productivity of $4,000/sq. ft. in Canada.

When it comes to seeding markets, LULU is well behind the 8 ball in its international growth story. Prior to the 57% 5yr CAGR we saw LULU put up in the US, the company had 78 stores and showrooms that laid the ground work for the material top line ramp we saw in subsequent years. To date, LULU international has 28 doors (12 full-price) throughout Europe and Asia. Cool stat, but what does that mean? We see two potential outcomes. Either… a) LULU slows down it’s Int’l growth objectives once it experiences some International turbulence, or b) the company continues to step up investment outside of North America and enters markets with below average brand awareness, which translates to lower sales, productivity, margins, and returns.

Lastly on margins… we know that LULU International is a dilutive business for the company today. We assume its profitability rate is -15%, which equates to a $20mm loss on $135mm in revenue and is ~300bps dilutive to reported EBIT margins. By the end of 2017 (full year 2018) we assume that International turns a profit, and over the longer-term hits a 10% EBIT margin on $700mm in revenue. On the march to profitability, that means an additional $45mm in EBIT dilution from International growth that will mostly be recognized in SG&A over the next two years. Because of the Int’l pricing dynamics, we don’t expect a material drag of merch margins. But because of the SG&A deleverage, it will mitigate the EBIT margin recapture over the near term.
Men’s, Will Outgrow UA?: To be fair, men’s has been knocking the cover off the ball for the better part of two years, with 20%+ comps in each of the past 10 quarters. And to weave a personal element into the discussion, we @HedgeyeRetail are net supporters of LULU men’s product. But to put LULU’s $1bn Men’s sales goal into context, we need to assume better than UA growth numbers. That implies a 5-yr revenue CAGR of 25% off a $330mm base. That’s higher than the Under Armour run we witnessed from 2006-2011 as it took its men’s apparel business from $425mm to $1.1bn. There are two key differences between what UA did and what LULU is trying to accomplish…

1) UA benefited from category expansion as it built off its base of compression gear, which back in 2006 accounted for 70%+ of the men’s apparel business. LULU has the category breadth, just not the floor space or brand awareness.
2) UA consumer touch points tripled from 2006-2011 from 8,700 doors to 25,000 doors, which in large part drove the incremental $625mm in sales (productivity per retail outlet was flat). At LULU we are looking at marginally more floor space in a 570 store footprint, which would imply a doubling of the unit productivity for men’s product.

The last point is more meaningful to long term profitability than one might otherwise think because of the investment associated with meaningfully growing a non-core piece in vertical retail. What did UA have to do? Increase production, negotiate more wholesale distribution agreements, develop excellent product ancillary to the core compression gear, and market the heck out of ‘Protect This House’. LULU’s growth plan includes all of that plus the additional capital investment associated with reconfiguring/enlarging stores to accept a greater array of men’s product. It’s e-commerce business makes it easier, but not meaningfully cheaper.
LULU’s Step Child: To be clear, the ivivva business as a standalone concept is nothing to scoff at. Productivity of $1000/sq.ft. on a 43 store footprint and positive EBIT margins on a sales base of $65million. The problem is that i) incremental capital is being invested to grow out the store footprint, and ii) the business is dilutive to the margin profile of the parent because of the lower ticket and similar store footprint/rent dynamics as lululemon proper. That’s not to say that it’s a failed strategy for the company (we’re modeling DD comps over the next 5 years), but that LULU bulls don’t fully understand the dilutive nature of ivivva growth to the margin and return profile of the company.

