The extreme bearish to bullish reversal in sentiment YTD in gold happened quickly (Jan.-Feb.). The pace of relative bullishness has decelerated, but the market remains notably long of gold:
- Gold is a chart with a story, and investors have repeatedly chased price on a lag. Gold has been a newsy item for the last month, AFTER the bullish move, and has since gone down on a 1-mth window (-3.6%) despite a 1) dovish pivot from the fed on growth and inflation; And, 2) a flatter curve and a weaker USD. Coincidentally historical USD/Gold correlations have broken down on that same window
- Net Futures and Options Positioning is +2.3x/+2.3x Long on a 1Yr and 3Yr Z-Score Basis
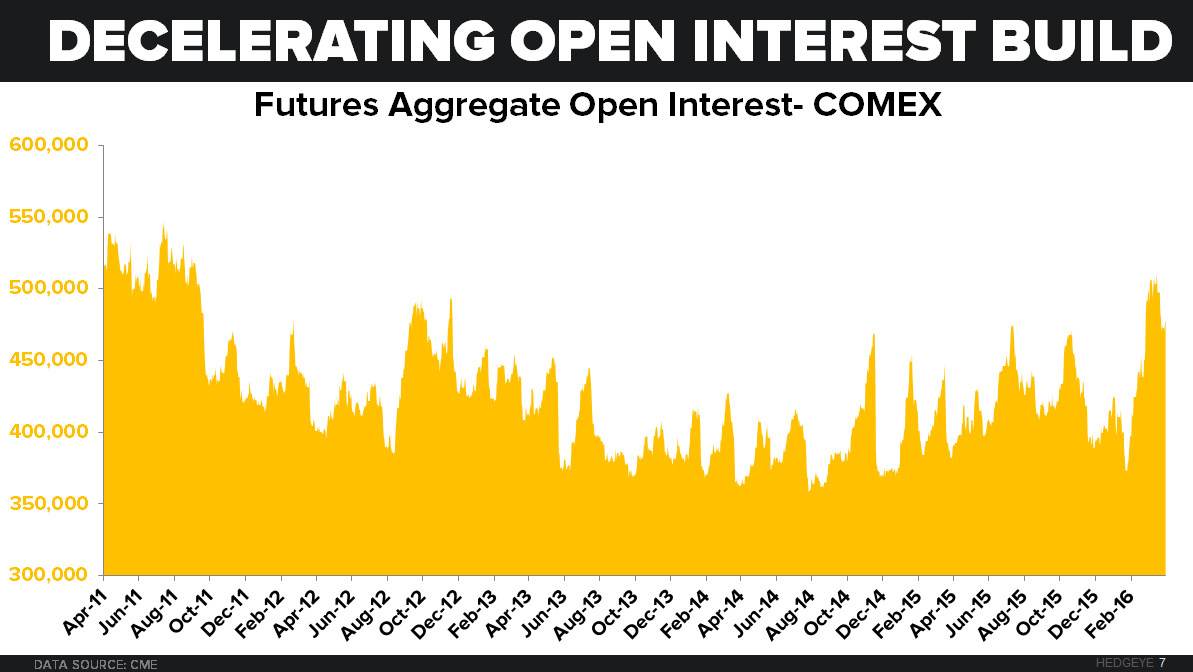
- After reaching the highest level of open interest since 2011 in March, the pace of open interest increases in all active futures months has slowed considerably, and is now flattening out. When put against the CFTC positioning, we know which way the outstanding OI is leaning
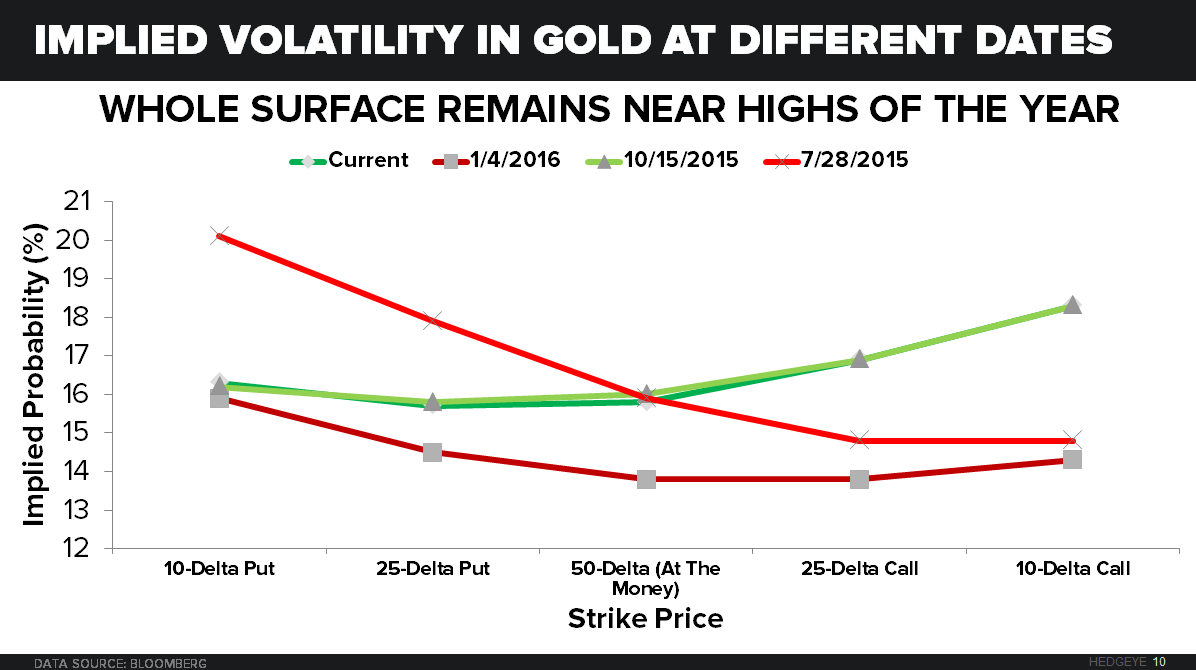
- Option skew (prices investors are willing to pay for calls vs. puts in volatility terms) shows bullish sentiment, which like the CFTC positioning, is a classic indicator that chases price. Currently the surface is shaped exactly how it was in mid-October (upside calls more expensive than downside puts in volatility terms). The opposite shape was priced-in moving into 2016. Putting this chart next to the CFTC positioning chart shows the intermediate-term price risk to stretched positioning.
Click HERE for a link to our February note adding NEM to our best ideas short list. For the corresponding model and blackbook, feel free to ping us back directly.