

Our Hedgeye Housing Compendium table (below) aspires to present the state of the housing market in a visually-friendly format that takes about 30 seconds to consume.

Today’s Focus: February Pending Home Sales
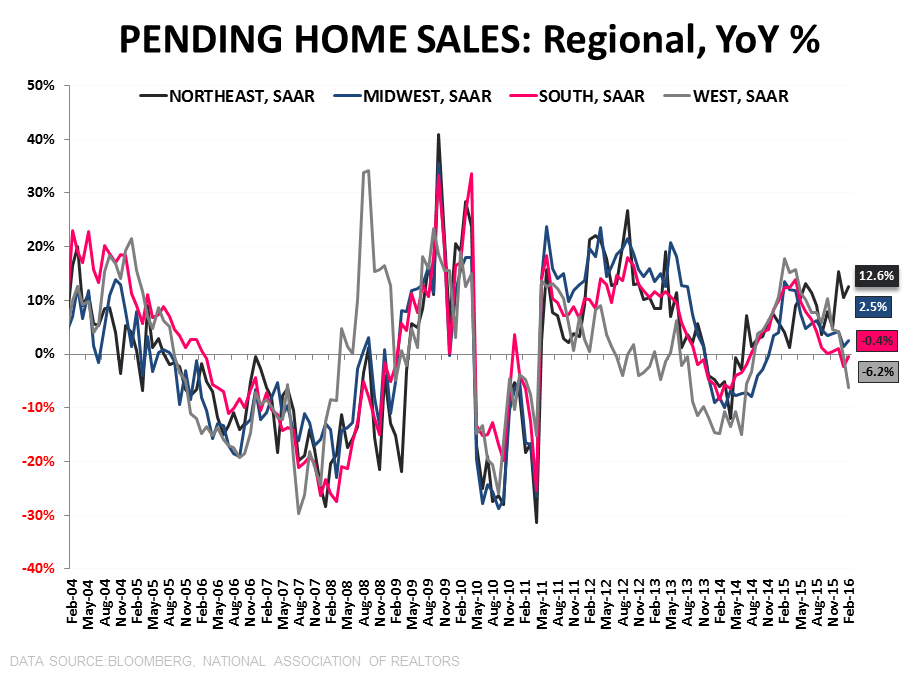
Signed contract activity in February rose +3.5% sequentially against downwardly revised January estimates while decelerating to +0.7% YoY on a seasonally-adjusted basis as growth slowed to its weakest pace in 18-months. On an NSA basis, year-over-year growth accelerated to +5.1%, bouncing off the worst rate of change print in 1.5 years in the previous month.
- Leap Day? It's unclear the extent to which the NAR adjusted the February report for the extra day in February. The seasonal adjustment factor was less supportive of the reported, seasonally-adjusted figures than in prior years so it was seemingly part of the adjustment calculus but it wasn't mentioned in the release and we couldn't find a specific reference in a methodology search. Unadjusted, the leap day would account for the entire +3.5% M/M increase.
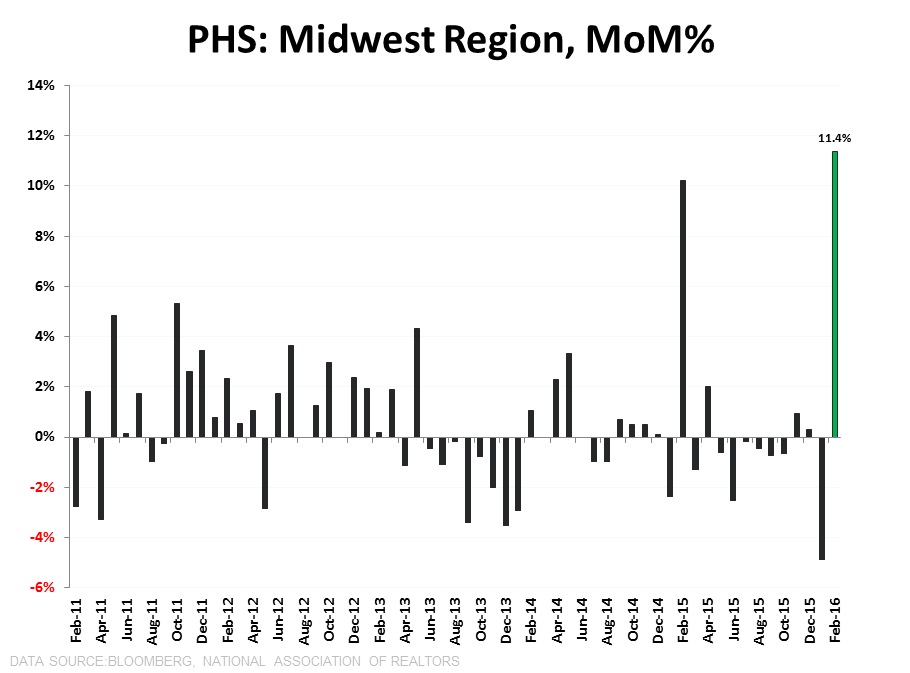
- Midwest Marvel: Notably, the Midwest was responsible for most of the sequential strength with sales rising +11.4% MoM (+61% MoM NSA) – the largest increase ever with the exception of December 2008. The NAR didn’t offer any commentary or speculation around the outsized gain in the region.
- Trend = Deceleration: January marks the 10th month of deceleration in PHS off the April 2015 peak. While activity in the existing market saw some moderate mojo in February, the larger Trend remains one of deceleration and we continue to expect that trend to extend for at least the next three months with volume growth going negative as comps steepen into April/May.
- EHS vs PHS: The risk to EHS in March is to the upside should closed transaction volume recouple with the trend in signed contract activity.


About Pending Home Sales:
The Pending Home Sales Index is a monthly data release from the National Association of Realtors (NAR) and is considered a leading indicator for housing activity in the US. It is a leading indicator for Existing Home Sales, not New Home Sales. A pending home sale reflects the signing of a contract, but not the closing of the transaction, which occurs 1-2 months later. The NAR uses data from the MLS and large brokers to calculate the Pending Home Sales index. An index value of 100 corresponds to the average level of activity during 2001.
Frequency:
The NAR Pending Home Sales index is released between the 25th and the 31st of each month and covers data from the prior month.
Joshua Steiner, CFA
Christian B. Drake
