

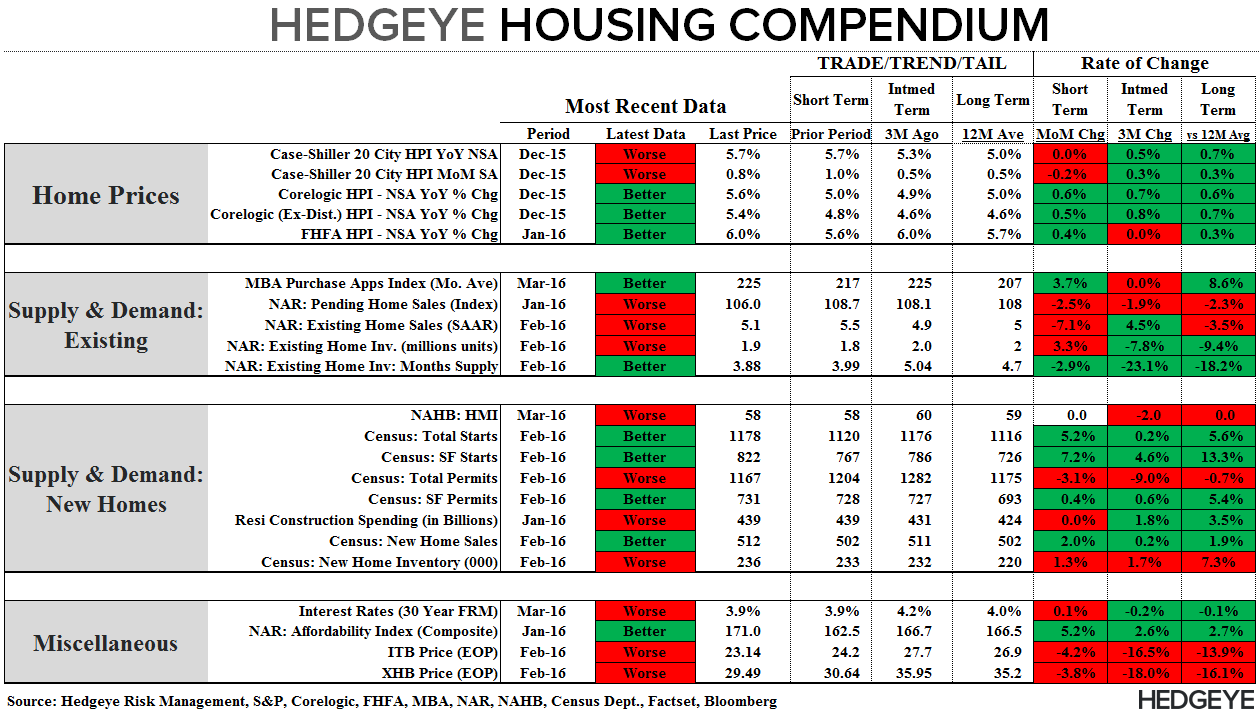
Our Hedgeye Housing Compendium table (below) aspires to present the state of the housing market in a visually-friendly format that takes about 30 seconds to consume.
Today’s Focus: New Home Sales for February
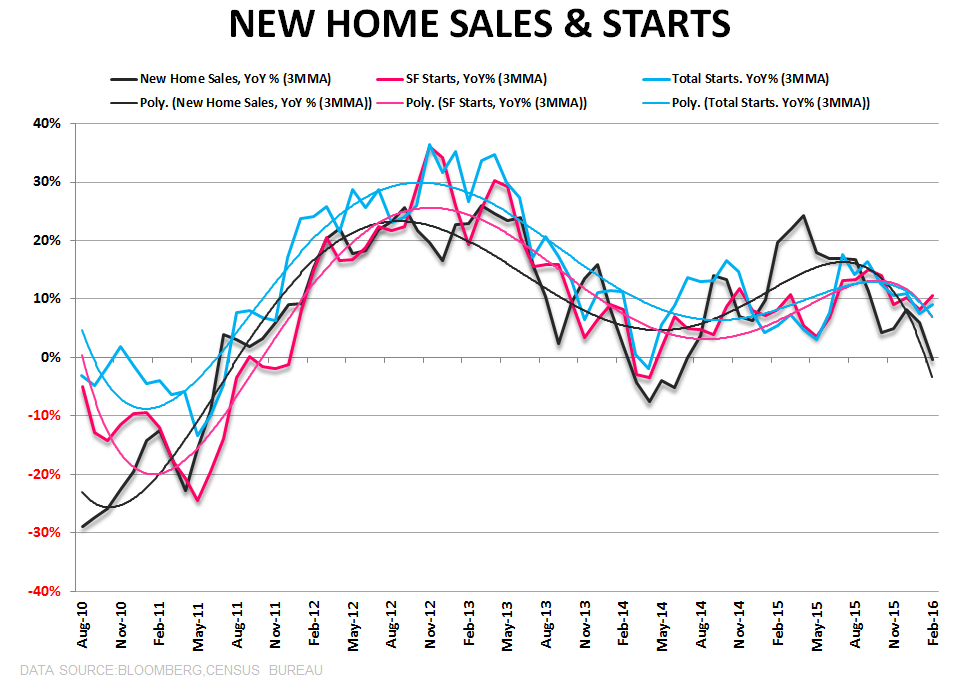
The NHS data is volatile and subject to significant error and revision which is why we don’t take an overly convicted view of any given month in isolation, giving deference to the larger trend. This morning’s New Home Sales data for February wasn’t good in isolation and continued the broader trend toward decelerating activity. The 1st three charts below capture that prevailing trend.
A few highlights:
- Sales: Sales rose +2.0% sequentially but fell to -6.1% YoY, marking the worst pace of growth in 21-months and the first consecutive months of negative year-over-year growth since 2011. This month went against the hardest comp of the cycle (Feb 2015 = +31% YoY) and compares ease the next couple months so the rate-of-change trend will probably see a modest bounce in March. That said, the trend has clearly been one of stalling demand as Sales, like Starts, have been flat to down on an absolute basis for the past year.
- Price Tier Pervasive: Deceleration characterized all price points with demand at the high end (>$500K) falling to -28% YoY with the lower end (sub-$300K) dropping to -8% YoY.
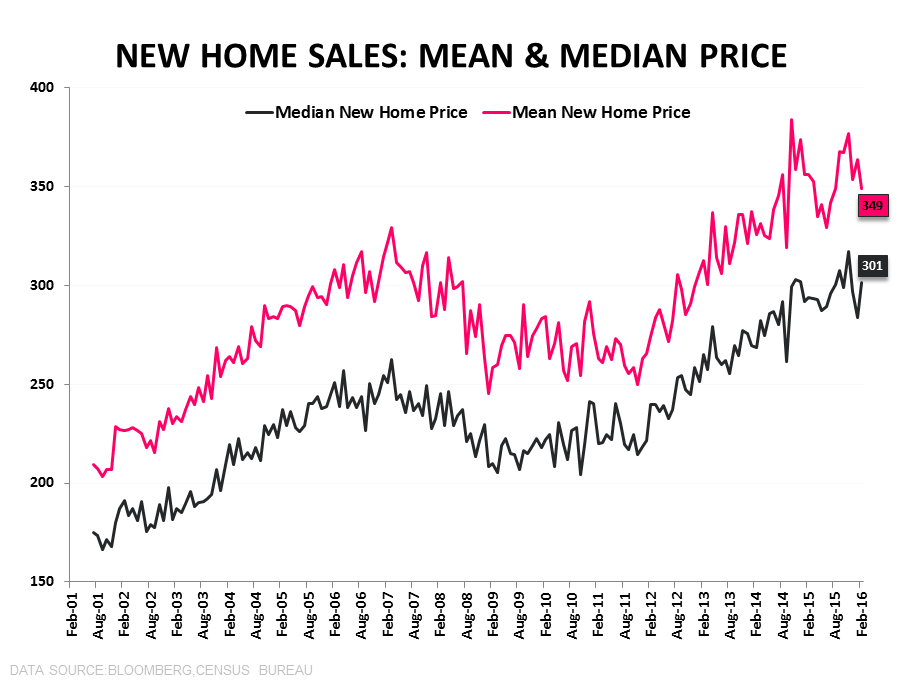
- Price & Supply: Median Prices rose +2.6% while months-supply was 5.6-months as unit supply rose +17% YoY to the highest level since October 2009.
- So …. With sales in the existing market (~90% of the market) slowing and looking increasingly likely to print negative YoY growth in the coming months (for more see: EHS | "Meaningfully" Weak) and trends in the new home market softening, housing demand is telling a cohesive story of deceleration – and one we expect to continue over the nearer-term.
As an aside, the WSJ reported yesterday (HERE) that the GSE’s (Fannie Mae and Freddie Mac) – after years of back & forth on the issue - are set to announce a principal forgiveness program for a select group of ~50K underwater homeowner’s.
There was little in terms of hard details on the proposal but the program, as it was described, carries a couple of notables:
- There are still 4.3 million borrowers with negative equity positions. No matter how theoretically justified the programs parameters, forgiving principal balances on just 50K of those will carry an air of arbitrariness/unfairness.
- Only forgiving balances for borrowers who have been delinquent is a slippery slope and probably sends the wrong message to the balance of underwater borrowers.
- In the unlikely scenario that every single one of these 50k homes came onto the market as a result, it would only increase inventory by 2-3% and do little to resolve the prevailing supply problem.
- Perhaps fully expanding the program evolves towards political viability but that potentiality probably sits intangibly long out on the timeline at present.


About New Home Sales:
Each month the Census Department releases the New Home Sales report, which measures the number of newly constructed homes that have been sold in the month. The difference between the New Home Sales report and the Starts and Permits report is that New Home Sales only includes single family spec homes built and sold by builders, and does not include condos, apartments, or owner-built units. This is why New Home Sales typically run at roughly half the rate of Starts.
Joshua Steiner, CFA
Christian B. Drake
