


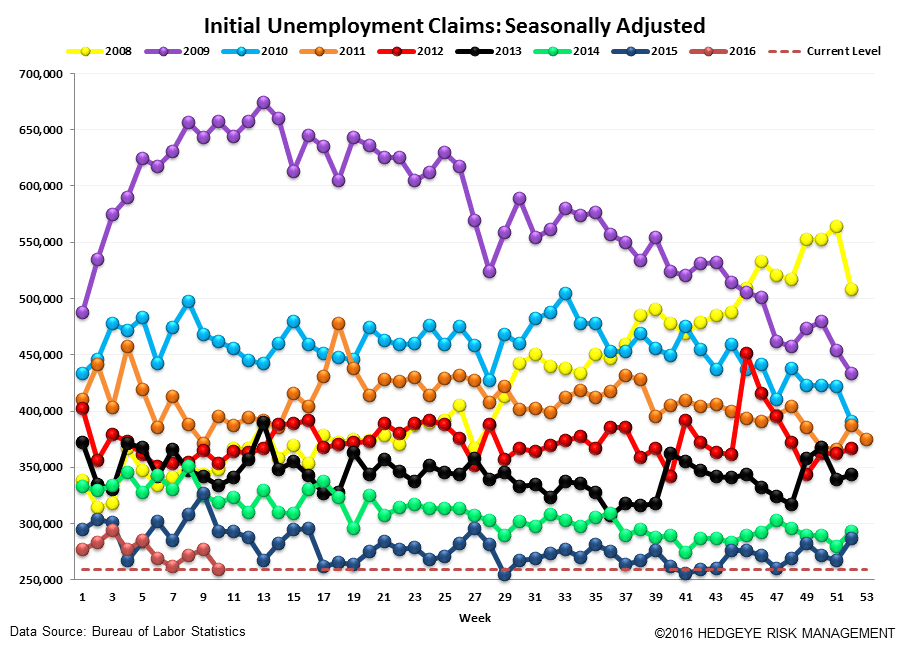
The labor market continues to hang in there. Last week, seasonally adjusted initial claims came in at 259k, a 19k week-over-week decrease, prior to revision. This brings the 4-wk moving average to 267.5k (a 2.5k w/w decline), which is low by any objective measure. While labor conditions in Energy states have shown notable deterioration, the country as a whole has offset those pockets of discreet weakness.
While we may sound a bit like a broken record on this point, we still think it bears worth repeating that the cycle is late stage. The chart below shows that there has historically been a time limit on how long the labor market can run this hot. The chart shows that in the last three cycles, claims have run below 330k for 24, 45, and 31 months before recession set in. The current sub-330k run just entered month 25. That puts us one month past the minimum, 8 months from the 33-month average, and 20 months from the 1990s record-setting expansion.

The following three charts show that the labor market in energy states has been deteriorating versus the rest of the country due to protracted weakness in energy prices.


The Data
Prior to revision, initial jobless claims fell 19k to 259k from 278k WoW, as the prior week's number was revised down by -1k to 277k.
The headline (unrevised) number shows claims were lower by 18k WoW. Meanwhile, the 4-week rolling average of seasonally-adjusted claims fell -2.5k WoW to 267.5k.
The 4-week rolling average of NSA claims, another way of evaluating the data, was -11.4% lower YoY, which is a sequential improvement versus the previous week's YoY change of -11.2%


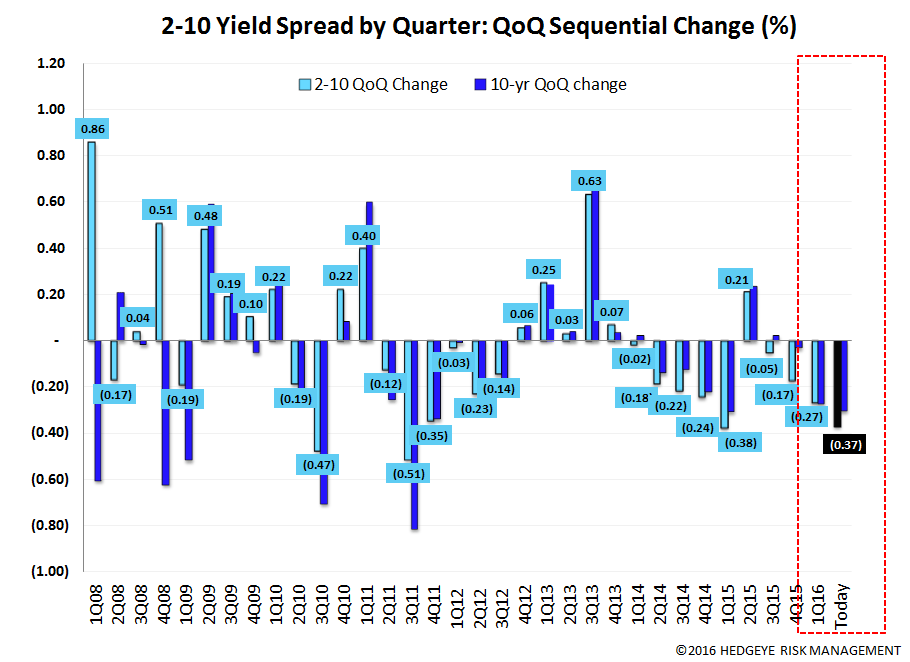
Yield Spreads
The 2-10 spread rose 1 basis points WoW to 99 bps. 1Q16TD, the 2-10 spread is averaging 109 bps, which is lower by -27 bps relative to 4Q15.

Joshua Steiner, CFA
Jonathan Casteleyn, CFA, CMT
