


Key Takeaway:
Last week's better than expected reading on non-farm payrolls coupled with the ongoing stabilization in oil has fueled an impressive relief rally. Our heatmap shows that CDS spread significantly tightened across the globe last week. Additionally, high yield YTM dropped 58 bps to 8.0%, and the Leveraged Loan index rose by 24 points.
While short-term readings have skewed positive over the last three weeks, intermediate and longer-term measures remain negative, on balance.
Current Ideas:

Financial Risk Monitor Summary
• Short-term(WoW): Positive / 8 of 13 improved / 3 out of 13 worsened / 2 of 13 unchanged
• Intermediate-term(WoW): Negative / 3 of 13 improved / 7 out of 13 worsened / 3 of 13 unchanged
• Long-term(WoW): Negative / 1 of 13 improved / 4 out of 13 worsened / 8 of 13 unchanged

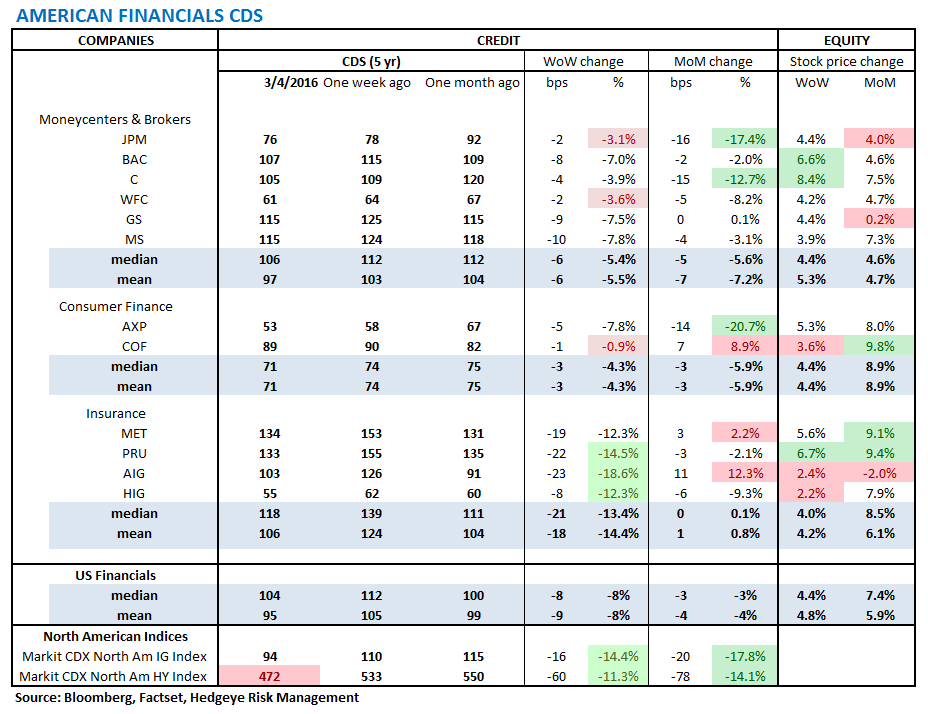
1. U.S. Financial CDS – Swaps tightened for 12 out of 27 domestic financial institutions. With last week's better than expected reading on non-farm payrolls, domestic CDS tightened by an average 9 bps.
Tightened the most WoW: AIG, PRU, HIG
Widened the most WoW: AGO, TRV, MBI
Tightened the most WoW: AXP, JPM, C
Widened the most MoM: AIG, COF, MET
2. European Financial CDS – With positive economic data from the United States and the continued stabalization in oil, swaps mostly tightened in Europe last week .

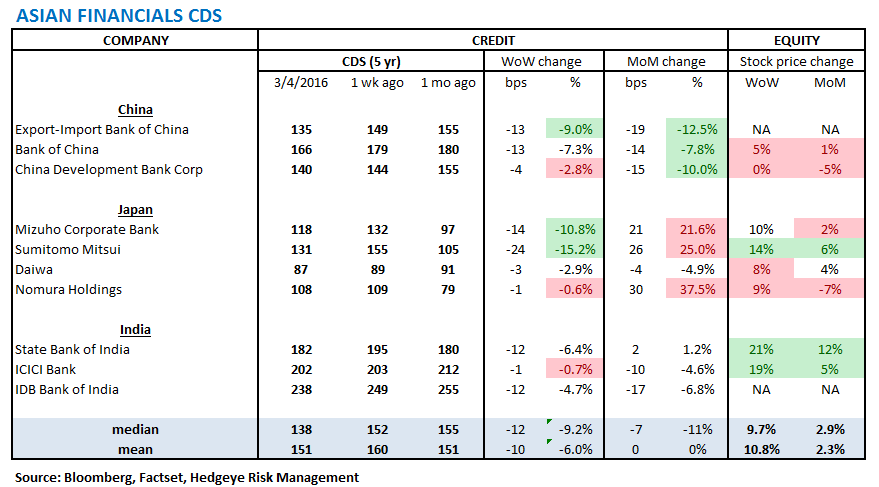
3. Asian Financial CDS – Swaps tightened across the board in Asia last week. Japan's Sumitomo Mitsui tightened the most, by 24 bps to 131.
4. Sovereign CDS – Sovereign Swaps mostly tightened over last week. Portuguese swaps tightened the most, by 57 bps to 268.


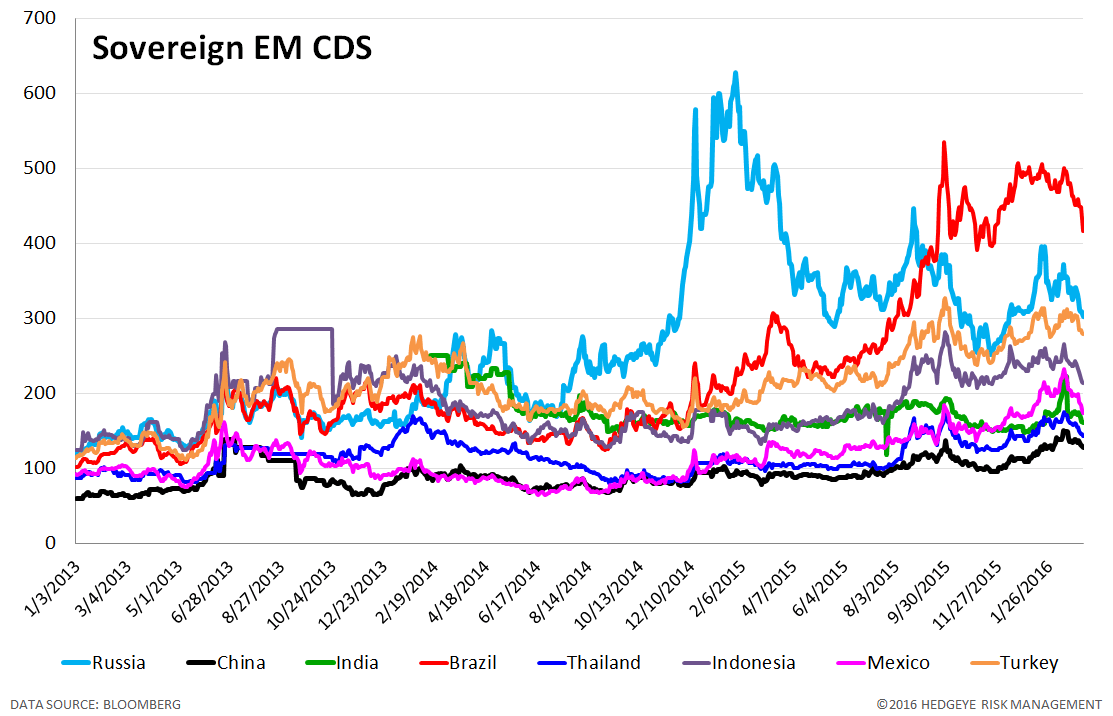
5. Emerging Market Sovereign CDS – Emerging market swaps tightened last week. Brazilian and Russian swaps tightened the most, by -40 bps to 416 and by -30 bps to 302 respectively.

6. High Yield (YTM) Monitor – High Yield rates fell 58 bps last week, ending the week at 7.99% versus 8.56% the prior week.

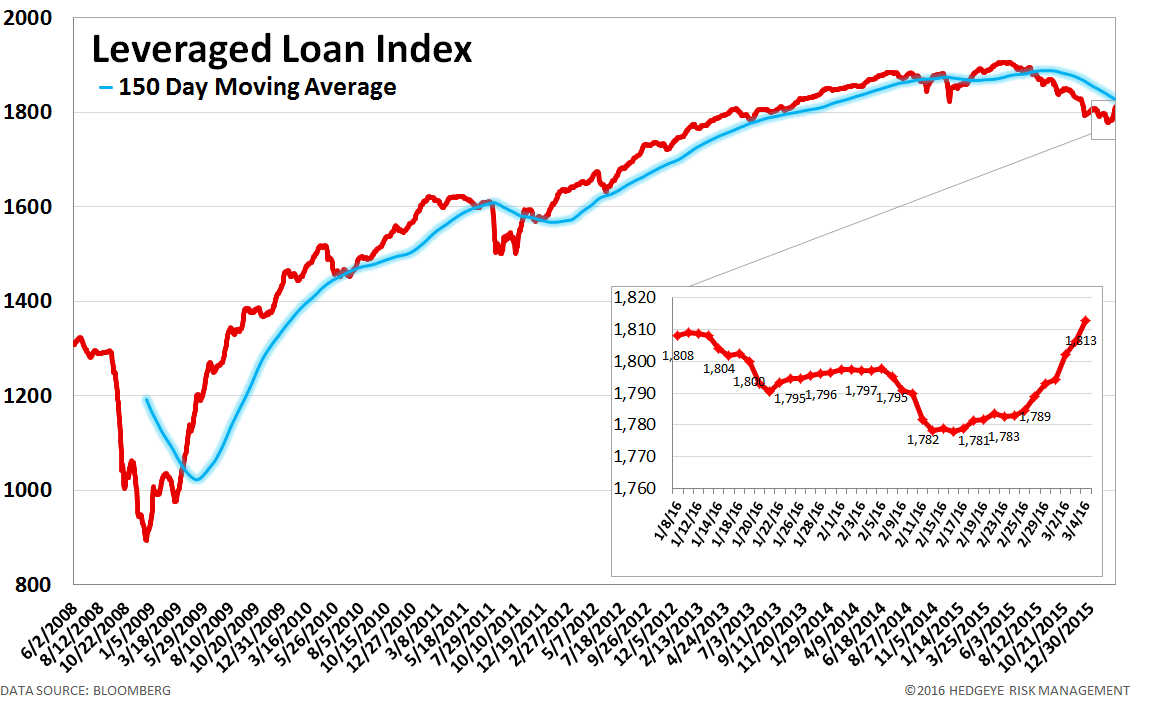
7. Leveraged Loan Index Monitor – The Leveraged Loan Index rose 24.0 points last week, ending at 1813.
8. TED Spread Monitor – The TED spread rose 5 basis points last week, ending the week at 37 bps this week versus last week’s print of 32 bps.

9. CRB Commodity Price Index – The CRB index rose 4.4%, ending the week at 169 versus 161 the prior week. As compared with the prior month, commodity prices have increased 4.1%. We generally regard changes in commodity prices on the margin as having meaningful consumption implications.

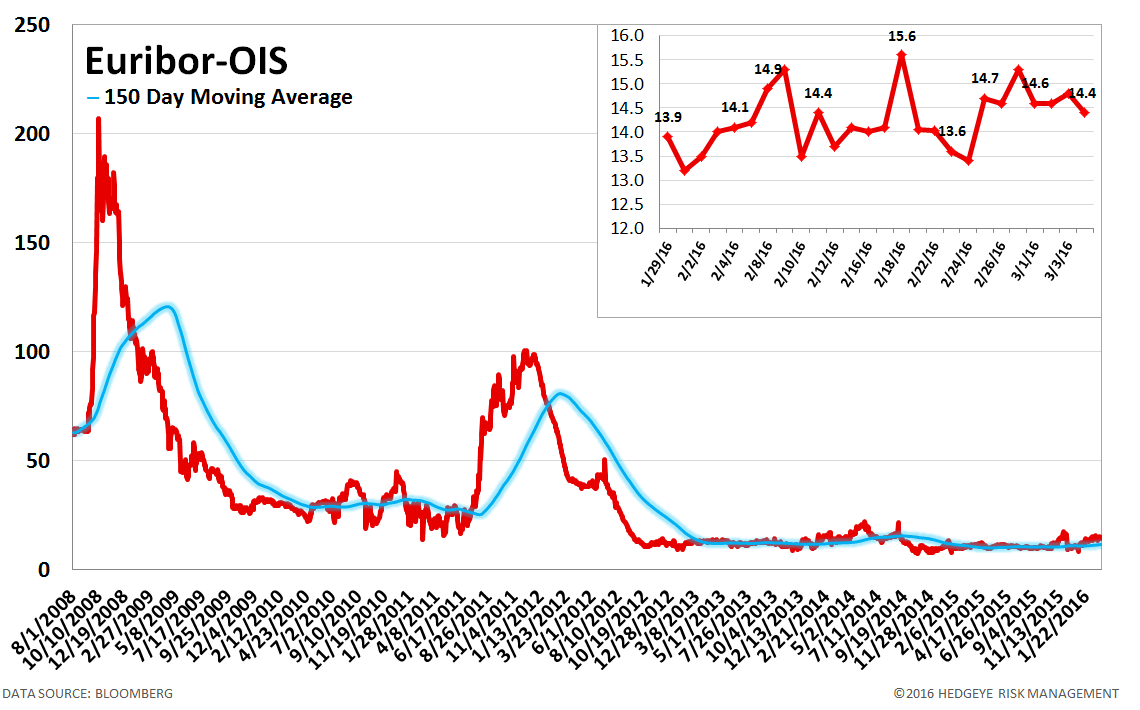
10. Euribor-OIS Spread – The Euribor-OIS spread (the difference between the euro interbank lending rate and overnight indexed swaps) measures bank counterparty risk in the Eurozone. The OIS is analogous to the effective Fed Funds rate in the United States. Banks lending at the OIS do not swap principal, so counterparty risk in the OIS is minimal. By contrast, the Euribor rate is the rate offered for unsecured interbank lending. Thus, the spread between the two isolates counterparty risk. The Euribor-OIS spread was unchanged at 14 bps.
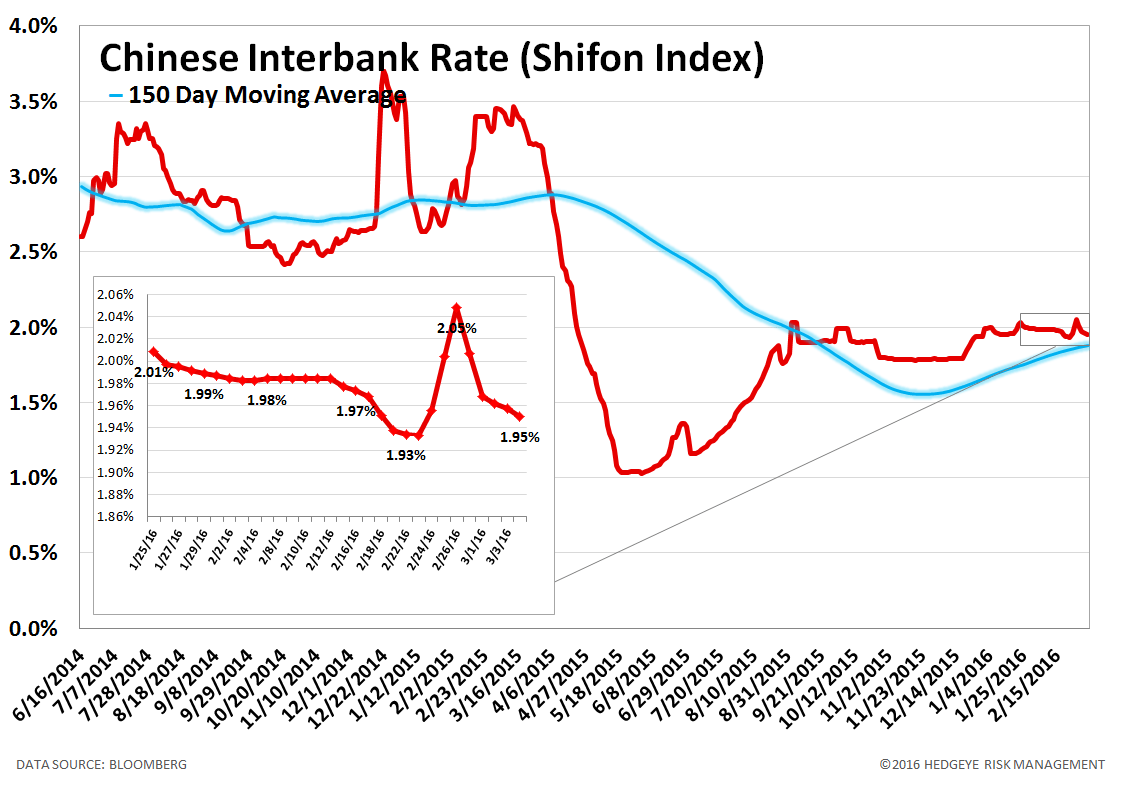
11. Chinese Interbank Rate (Shifon Index) – The Shifon Index fell 10 basis points last week, ending the week at 1.95% versus last week’s print of 2.05%. The Shifon Index measures banks’ overnight lending rates to one another, a gauge of systemic stress in the Chinese banking system.
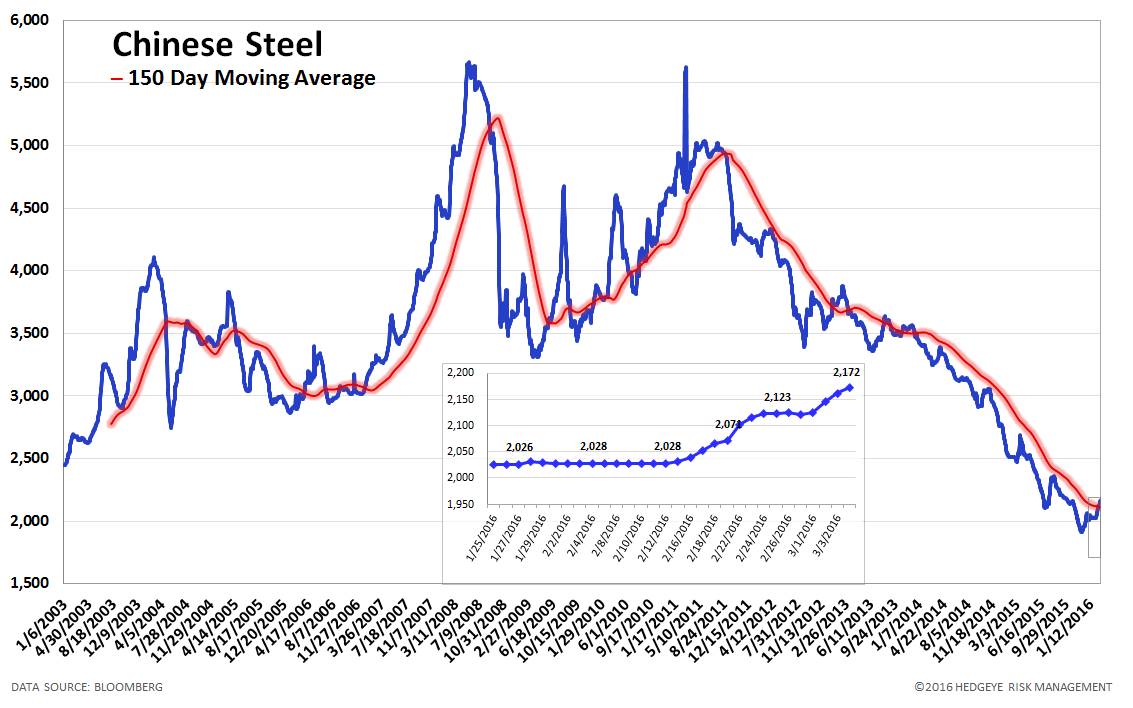
12. Chinese Steel – Steel prices in China rose 2.2% last week, or 47 yuan/ton, to 2172 yuan/ton. We use Chinese steel rebar prices to gauge Chinese construction activity and, by extension, the health of the Chinese economy.
13. 2-10 Spread – Last week the 2-10 spread widened to 101 bps, 4 bps wider than a week ago. We track the 2-10 spread as an indicator of bank margin pressure.

14. CDOR-OIS Spread – The CDOR-OIS spread is the Canadian equivalent of the Euribor-OIS spread. It is the difference between the Canadian interbank lending rate and overnight indexed swaps, and it measures bank counterparty risk in Canada. The CDOR-OIS spread widened by 2 bps to 41 bps.

Joshua Steiner, CFA
Jonathan Casteleyn, CFA, CMT
